Fig 2. Distribution of genotype frequencies within COVID-19 category for rs2074192 and rs233574 only in females, and for rs699 in both females and males. Figures within orange bars represent number of individuals in the mild groups, while figures on top of blue bars represent number of individuals in the moderate (MOD) or severe (SV) groups. ns: not significant.
2024-07-17 | | |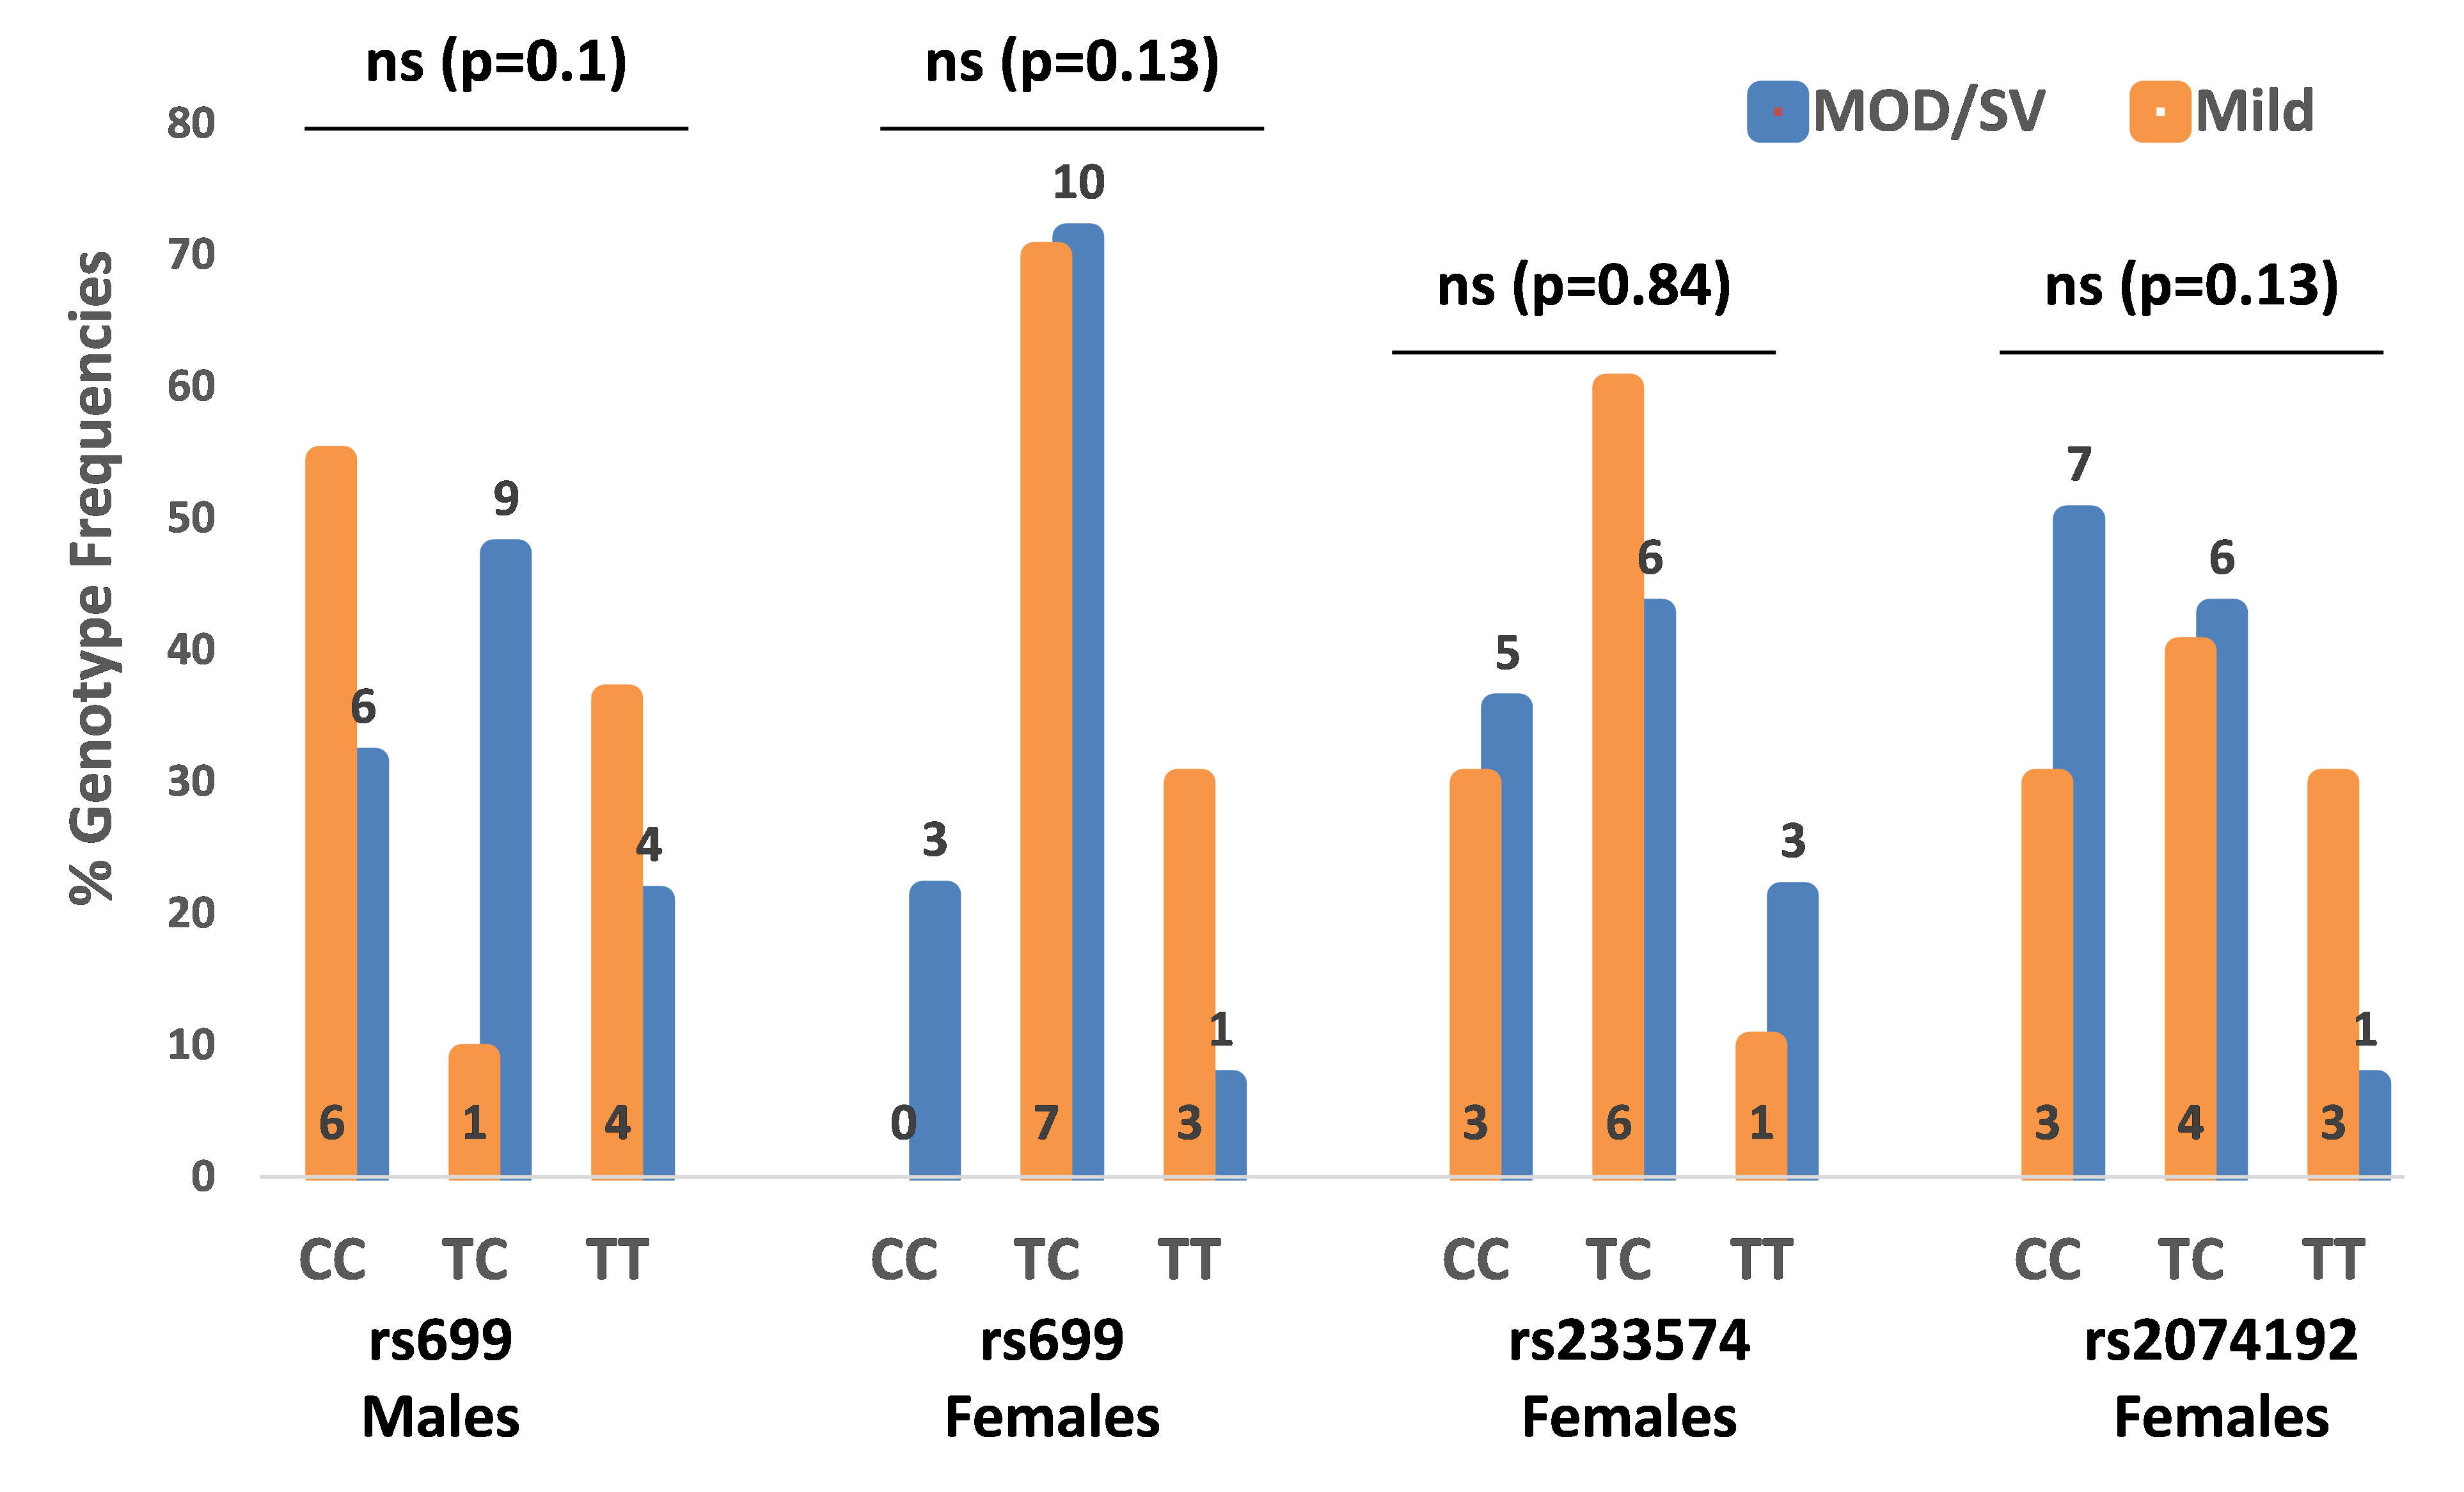
Fig 2. Distribution of genotype frequencies within COVID-19 category for rs2074192 and rs233574 only in females, and for rs699 in both females and males. Figures within orange bars represent number of individuals in the mild groups, while figures on top of blue bars represent number of individuals in the moderate (MOD) or severe (SV) groups. ns: not significant.
(ISSN - Online)
2959-8591