Fig. 3. Comparison of gels viewed under UV radiation after electrophoresis, (A) human genome samples on corn starch gel 12 % in wells from 1 to 4, (B) human genome samples on agar – gelatin mixture gel 1% in wells from 1 to 4, (C) human genome samples on agar gel 1% in wells from 1 to 4 and Ladder in the 5 lane, (D) human genome samples on agarose gel 1% in wells from 1 to 4 and Ladder in the 5th – positive control, (E) human genome samples on treated food grade agar – agar gel 1.5 % in wells from 1 to 4 and Ladder in the 5th lane.
2024-09-30 | | |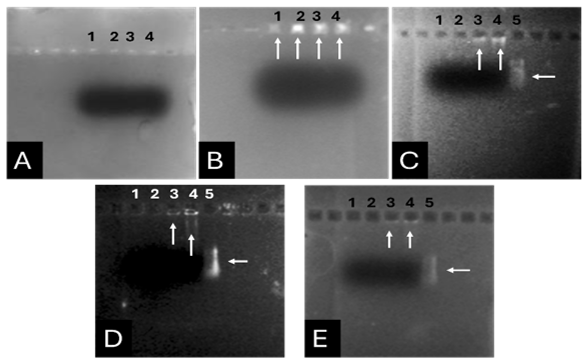
Fig. 3. Comparison of gels viewed under UV radiation after electrophoresis, (A) human genome samples on corn starch gel 12 % in wells from 1 to 4, (B) human genome samples on agar – gelatin mixture gel 1% in wells from 1 to 4, (C) human genome samples on agar gel 1% in wells from 1 to 4 and Ladder in the 5 lane, (D) human genome samples on agarose gel 1% in wells from 1 to 4 and Ladder in the 5th – positive control, (E) human genome samples on treated food grade agar – agar gel 1.5 % in wells from 1 to 4 and Ladder in the 5th lane.
(ISSN - Online)
2959-8591