The Effectiveness of CNN in Evaluating Ultrasound Image Datasets: Diagnosing Polycystic Ovary Syndrome (PCOS) as an Example
2023-04-18 | Volume 1 Issue 1 - Volume 1 | Research Articles | Mohammed Hayyan Alsibai | Seyed Youssef HeydariAbstract
Deep learning has proved its potential and the vital role it can provide in benefitting and assisting practitioners that use ultrasonography as a tool for diagnosis. However, medical datasets are often very difficult to obtain. Moreover, erroneous or fake training datasets may lead to inaccurate results. This paper is discussing the robustness of deep learning in diagnosing polycystic ovary syndrome (PCOS). Two public online data sets were used to train and test the ability of transfer learning using DenseNet201 architecture in detecting the infected ovaries. The two datasets showed different results although the same model, architecture and parameters were used. Further investigation showed that one of the data sets is extremely erroneous and of misleading information. In conclusion, Convolutional Neural Networks (CNN) and Transfer Learning can be considered as a strong tool to evaluate datasets.
Keywords : Convolutional Neural Networks (CNNs); Transfer Learning; Deep Learning; Polycystic Ovary Syndrome (PCOS); Medical Ultrasound Image Processing; Classification; Misleading Datasets.
Introduction
Polycystic ovary syndrome (PCOS) is one of the most prevalent conditions affecting women of reproductive age. It affects 6%–20% of premenopausal women globally (1). Ovarian dysfunction and an excess of androgen are the two main symptoms of PCOS. Menstrual abnormalities, hirsutism, obesity, insulin resistance, cardiovascular disease, in addition to emotional symptoms like depression (2) are all common among PCOS patients (3). As a result, it is crucial for the accurate diagnosis and treatment of PCOS. In 1985, Adams et al. (4) discovered that polycystic ovaries have an abnormally high number of follicles, also termed multifollicularity. It was suggested that PCOS be diagnosed when at least two of the three following features were present at an expert meeting in Rotterdam in 2003: (i) oligo- or anovulation, (ii) clinical and/or biochemical hyperandrogenism, or (iii) polycystic ovaries (5). The latter of which can be detected using ultrasonography which offers the highest contribution to the diagnosis of PCOS (6). Early detection of PCOS is important because it can help to manage the symptoms and reduce the risk of long-term health issues. Although ultrasound images have some disadvantages of strong artifacts, noise and high dependence on the experience of doctors, they are still considered as one of the most widely used modalities in medical diagnosis. Many artificial intelligence systems have been developed to help doctors. Convolutional Neural Networks (CNNs) and deep learning have achieved great success in computer vision with its unique advantages (7). Many diseases are diagnosed using different Deep Learning Models (7). Some examples include the detection of COVID-19 using lung ultrasound imagery achieving 89.1% accuracy using InceptionV3 network (8), the use of deep learning architectures for the segmentation of the left ventricle of the heart (9), and the classification of breast lesions in ultrasound images obtaining an accuracy of 90%, sensitivity of 86%, and specificity of 96% by utilizing the GoogLeNet CNN (10). As we can see, deep learning has proved its potential and the vital role it can provide in benefitting and assisting practitioners that use ultrasonography as a tool for diagnosis. This paper is discussing the robustness of deep learning in diagnosing PCOS. Since arificial intelligence (AI) and deep learning algorithms can quickly and reliably assess vast volumes of data, they can be utilized to diagnose PCOS in ultrasound scans. AI and deep learning algorithms are expected to examine ultrasound images to find patterns and traits that are indicative of PCOS in the case of PCOS detection. This can help to increase the speed and accuracy of diagnosis as it can be done more accurately and efficiently than by manual analysis. Furthermore, the application of AI and deep learning in the diagnosis of PCOS can decrease the workload for medical professionals and free them up to concentrate on other responsibilities. Overall, the use of AI and deep learning in the detection of PCOS in ultrasound images has the potential to improve the accuracy, efficiency, and accessibility of healthcare. This was the motive to tackle such an important health issue that affects millions of women worldwide and apply the potential of deep learning to help nullify this crucial problem. Obtaining a viable and correct ultrasound dataset for this task is difficult as the annotation of medical images requires significant professional medical knowledge, which makes the annotation very expensive and rare as well as the ethical issues and sensitivity of such dataset which can pose another problem. Therefore, resorting to a publicly available dataset was chosen to accelerate the work on this project. After observing some of the related work, one publicly available PCOS dataset was utilized in the training of PCONet, a CNN developed by Hosain AK et al. that detects PCOS from ovarian ultrasound images with accuracy of 98.12% on test images as well as fine-tuning InceptionV3 model achieving 96.56% accuracy (11). The PCOS dataset is publicly available on Kaggle (12). Other related work includes Wenqi Lv et al. who utilized image segmentation technique using U-Net on scleral images then a Resnet model was adapted for feature extraction of PCOS achieving classification accuracy of 0.929, and AUC of 0.979 (13). Subrato Bharati et al. used clinical attributes of 541 women in which 177 are infected with PCOS to be utilized in a machine learning model that uses random forest and logistic regression to predict PCOS disease for which the testing accuracy achieved is 91.01% (14). Sakshi Srivastava et al. employed a fine-tuned VGG-16 model to train on their dataset that consists of ultrasound images of the ovaries to detect the presence ovarian cyst with 92.11% accuracy obtained (15). In this paper, the Kaggle dataset highlighted previously is used to conduct training by enhancing the power of transfer learning to train an existing model architecture that is pre-trained on thousands of images in advance. The training on this dataset achieves excellent results. However, after achieving great results and after further inspection on the dataset, it turned out that the publicly available PCOS dataset that was utilized in training the fine-tuned model and that other authors (11) have been using in their research is extremely erroneous and full of misleading information. This will be discussed in details in this paper.
Methodology
Dataset Description
An appropriate dataset is vital for the proper functioning of any deep learning framework.
Thus, the publicly available PCOS ultrasound images available on Kaggle (12) is used. This same dataset is referred to as dataset A in the highlighted paper of Hosain AK et al. (11) mentioned previously and will be referred to as dataset A in this paper as well. A screenshot of the website providing this data is shown in Figure 1 and Figure 2.

Figure 1: Screenshot of the publicly available PCOS dataset on Kaggle consisting of `infected` and `notinfected` ovarian ultrasound images referred to as Dataset A
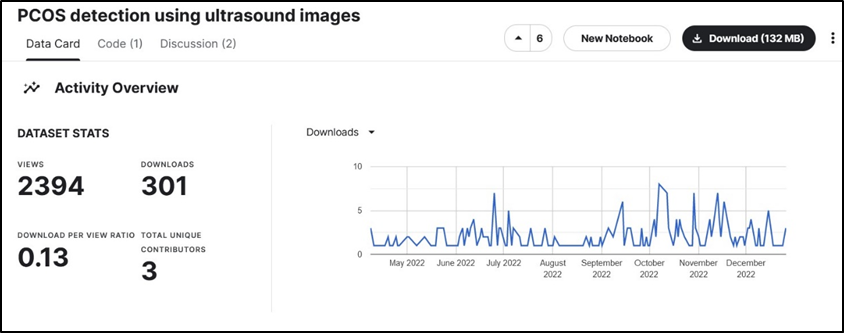
Figure 2: Statistics of Dataset A show that it is downloaded 301 times out of 2394 views. This means that almost 1 out of every 10 viewers downloads this dataset for utilization in research/projects
The dataset consists of 3856 ultrasound images divided into 2 classes which are labeled as: `infected` and `notinfected`. The latter depicts healthy ovaries and the first indicates the presence of PCOS. These images are partitioned into train and test sets in which 1932 images belong to the test set and the rest belong to the train set. However, the same images seem to be repeated in the test and train directories. Therefore, one of the directories was neglected. Figure 3 depicts a sample of the ultrasound images present in this dataset.
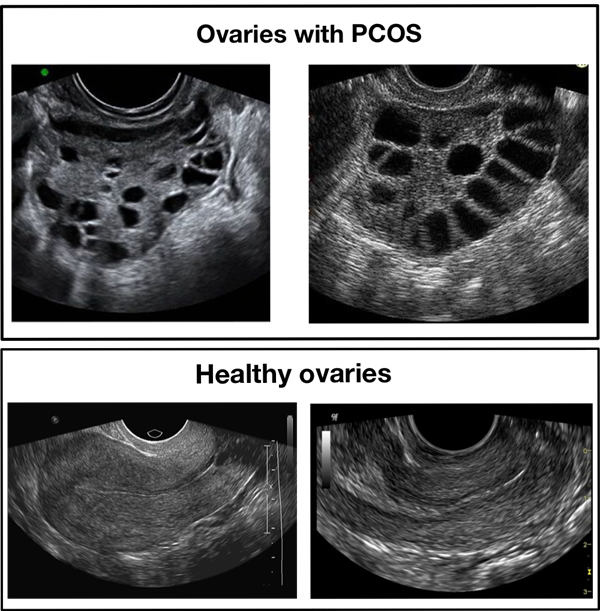
Figure 3: Samples of infected and healthy ovaries in Dataset A
Data Pre-Processing
There are several steps that may be taken to preprocess medical ultrasound images before they are input into a deep learning model for training. It’s important to note that the specific preprocessing steps will depend on the characteristics of the images and the specific requirements of the deep learning model being used. Since the model chosen for this project is the DenseNet201 architecture which is a pre-trained model on the ImageNet dataset, the ovarian ultrasound images that will be the input to this model need to be pre-processed the same way as the images this model was originally trained on. These images vary in size and dimensions therefore they need to be preprocessed so that they are uniform in this aspect. The preprocessing pipeline include:
- Resizing all the images into the same size of (224, 224), which is the image size that DenseNet201 was trained on.
- Transforming the images into tensors. In Pytorch which is the deep learning of choice for this project, a tensor is a multi-dimensional array that is similar to a Numpy array, but can be operated on by the GPU, which makes it more efficient for certain types of computations. Tensors can be used to store a wide variety of data, including images, videos, and audio, and are an important building block in PyTorch. The resulting tensor has the same number of dimensions as the original image, with the size of each dimension being the size of the corresponding image dimension. The pixel values of the image are also normalized to the range [0,1] when converted to tensors.
- Normalize the images: It is common to normalize the images by subtracting the mean and dividing by the standard deviation of the image pixels. This helps to center the data and improve the model’s ability to learn from it. The mean and standard deviation values for each color channel are:
mean = [0.485, 0.456, 0.406] std = [0.229, 0.224, 0.225]
This is done due to it being mentioned as a necessary pre-process in the documentation (16) of DenseNet201.
- Transforming all ultrasound images to grayscale as this will eliminate the unnecessary color channels if they exist and the resultant image will have only 1 color channel due to it being grayscale.
- The images and their corresponding labels are turned into batches where each batch consists of 32 images. This is very beneficial for a variety of reasons:
- Memory constraints: Training a deep learning model on a large dataset can require a lot of memory. Grouping the images into batches allows the model to train on a subset of the data at a time, which can be more memory efficient.
- Computational efficiency: Processing the images in batches can be more computationally efficient, as it allows the model to make better use of the parallel processing capabilities of modern hardware such as GPUs.
- Stochastic gradient descent: When training a model using stochastic gradient descent, it is common to update the model’s weights using the gradients computed on a small batch of data rather than the entire dataset. This is because computing the gradients on the full dataset can be computationally expensive, and using a smaller batch of data can provide a good approximation.
- Regularization: Using small batches of data can also introduce noise into the learning process, which can act as a form of regularization and help the model generalize better to new data.
Model Description
After pre-processing the data, a classification model is needed. Reviewing related work, most of research done in the medical field that uses deep learning utilizes transfer learning to train on the data through a pre-trained model. In fact, the conclusion of paper (17) mentions that transfer learning is the best available option for training even if the data model is pre-trained on, it is weakly related to data in hand.
Thus, in order to train on this dataset, the DenseNet architecture (18) was chosen. DenseNet is one of the leading architectures used in ultrasonography analysis when conducting transfer learning as table 3 in this paper (19) shows. DenseNet is a variation of the traditional CNN architecture that uses dense blocks, where each layer in a block is connected to every other layer in the block. This allows the network to pass information from earlier layers to later layers more efficiently, alleviate the problem of vanishing gradients in deeper networks, and can improve performance on tasks such as image classification. There are several variations of the DenseNet architecture, such as DenseNet121, DenseNet201, and DenseNet264. Each variation refers to the number of layers it consists of. DenseNet201 is the variation chosen for this project as it has a moderate number of layers and it is not too computationally demanding. DenseNet and many other pre-trained architectures are pre-trained on the ImageNet dataset which is long-standing landmark in computer vision (20). It consists of 1,281,167 training images, 50,000 validation images, and 100,000 test images belonging to 1000 classes. These images consist of a wide variety of scenes, covering a diverse range of categories such as animals, vehicles, household objects, food, clothing, musical instruments, body parts, and much more. A question might arise from this information, why would a model trained on a such unrelated dataset might be used for training on and predicting medical images? In fact, the paper titled “A scoping review of transfer learning research on medical image analysis using ImageNet” (19) discusses this very topic. After inspecting tens of research papers and studies that utilize ImageNet models to train on medical datasets, Author proves that transfer learning of ImageNet models is a viable option to train on medical datasets. The idea behind transfer learning is that although medical datasets are different from non-medical datasets, the low-level features (e.g., straight and curved lines that construct images) are universal to most of the image analysis tasks (21). Therefore, transferred parameters (i.e., weights) may serve as a powerful set of features, which reduce the need for a large dataset as well as the training time and memory cost (21). The structure of DenseNet is shown in figure 4:
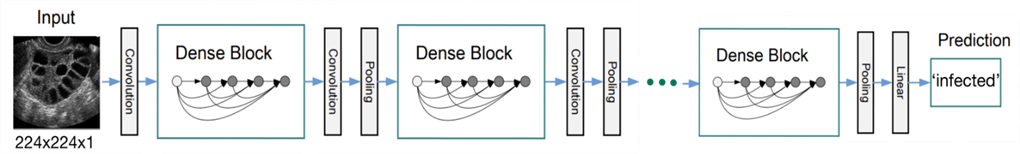
Figure 4: An ultrasound image with size (224, 224, 1) as an input to the DenseNet model using its weights and architecture to make a prediction
Model Fine-Tuning
Transfer learning can be utilized to import the DenseNet201 model and fine-tune it to adjust it to according to the dataset. This fine-tuning in this study involves 2 stages:
- Adjusting the very first layer to make it accept grayscale images that are composed of 1 color channel as opposed to 3 color channels that the ImageNet dataset consists of which is used to train the DenseNet201 model on. This is a better method than expanding a single channel to channels because it requires additional resources to store and process the additional channels that don’t provide any new information.
- ImageNet dataset consists of 1000 classes. Therefore, the DenseNet201 model also has 1000 corresponding outputs, 1 output probability for each class. This dataset consists of 2 classes only. Thus, the very last layer is adjusted to output 1 probability only which will be rounded to either 0 if the value is below 0.5 which indicates that the image is `infected` or 1 if the value is above 0.5 which signifies that the image is `not infected`. The raw output of the model i.e., the logit which is the final unnormalized score of the model (unbounded real number) is converted into a probability (range 0à1) using the sigmoid function: σ(x)=1/(1+e^(-x) ) where x is the model logit. After the logit is converted into a probability, it is converted into label (0 or 1) by rounding the probability into either 0 or 1 to indicate the prediction of the model.
After fine-tuning the model, the total number of parameters in the model is 18,088,577 in which 1,921 is trainable, and 18,086,656 is non-trainable (frozen).
Picking Loss Function and Optimizer
When working on binary classification in PyTorch, the most common loss function to use is binary cross-entropy loss, also known as log loss. This loss function is appropriate for binary classification problems where the output of the model is a probability, and the goal is to minimize the difference between the predicted probabilities and the true labels. The loss is calculated as:
loss = -(y * log(p) + (1 – y) * log(1 – p))
As for the optimizer, the two most common optimizers used are Adam and Stochastic Gradient Descent (SGD). The latter was the choice for this project as this paper (22) mentions that SGD generally performs better on image classification tasks. The optimizer and the learning rate are closely related, as the optimizer uses the learning rate to determine the step size when making updates to the model parameters. The learning rate opted for is 0.01.
Results:
After conducting the above steps and setting the learning rate to 0.01, the optimizer is set to SGD and training the model is initiated for 15 epochs. Moreover, the model had its pre-trained weights frozen except for its final Linear layer. This method is recommended in the paper (19) for models trained on ImageNet architectures. Exceptional results were achieved with 100% accuracy on the train set and 99.83% on the test set. The following two figures show the loss and accuracy during training in addition to the confusion matrix obtained by the results of the trained model predicting on the test set. Since the results are suspiciously perfect, we decided to investigate more using another dataset.
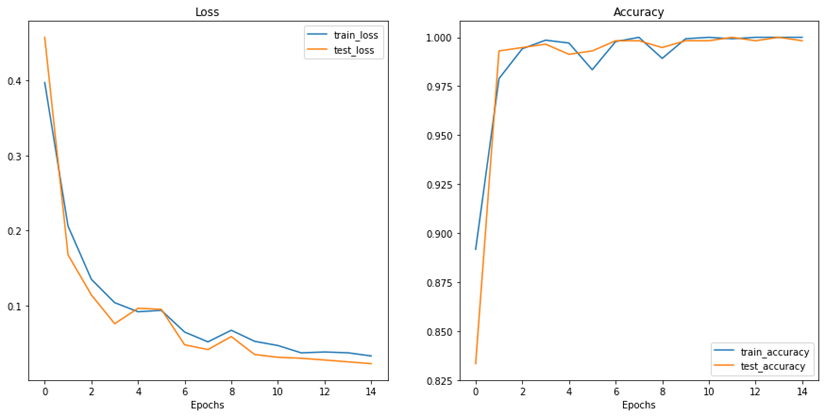
Figure 5: Results of loss and accuracy during training epochs
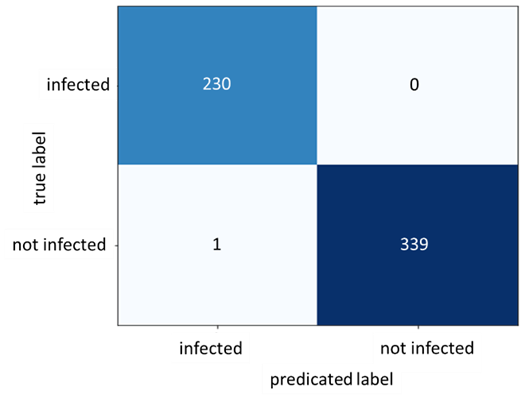
Figure 6: Confusion Matrix for Dataset A
Working with a New Dataset
Same experiment using the same parameters was repeated on another dataset: Dataset B. Another publicly available dataset is published by Telkom University Dataverse (23). Figure 7 shows a screenshot of the website providing this data. Dataset B consists of 54 ultrasound images 14 of which are classified as PCOS and the rest are normal. Figure 8 below shows a sample from this dataset.
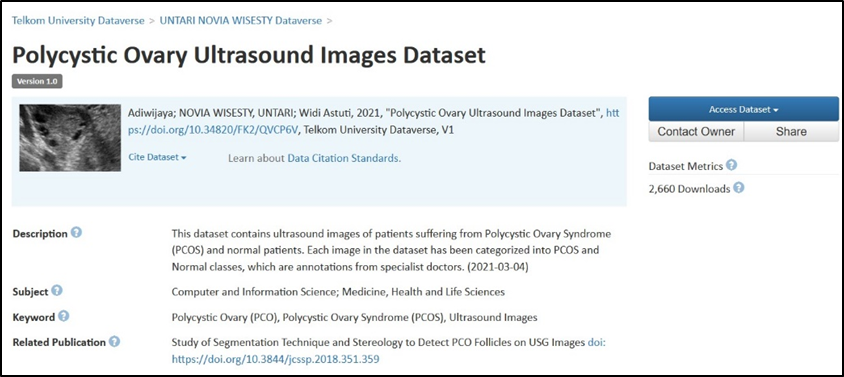
Figure 7: Screenshot of the publicly available PCOS dataset by Telkom University Dataverse referred to as Dataset B in this paper which is an ovarian ultrasound dataset that is annotated by specialist doctors
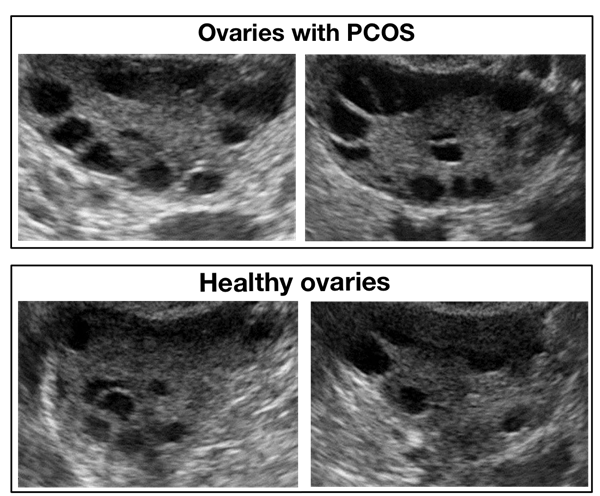
Figure 8: Samples of infected and healthy ovaries in Dataset B
However, to keep the two experiments identical and due to the problem of dataset B being relatively small in data number, data augmentation techniques such as random horizontal flipping, random vertical flipping, random brightness alteration, and random rotation are applied using the Python library `imgaug`. Data augmentation increases the number of ultrasound images which improves the training process massively.
Dataset B Results
After training the same model again for 15 epochs on this new dataset and keeping all the hyperparameters fixed, the following results and confusion matrix are obtained:
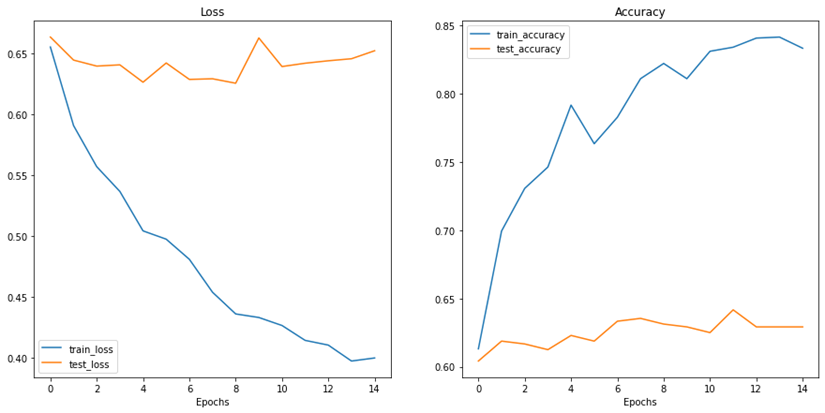
Figure 9: Results of accuracy and loss during training epochs with the new data for Dataset B
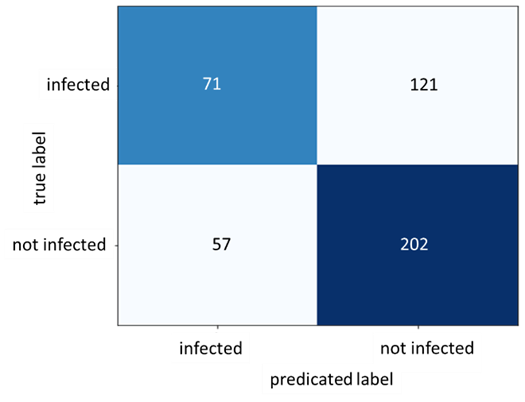
Figure 10: Confusion Matrix for Dataset B
As figure 9 shows, the train accuracy increases steadily until it reaches 83.33% while the test accuracy remains relatively unchanged at 62.92%. The same can be observed for train and test loss where the train loss steadily decreases but not for the test loss. This is a clear indication of overfitting and the inability of the model to generalize well on unseen data. The poor model performance is also confirmed in the confusion matrix where the number of true positives and true negatives is unsatisfactory.
Table 1 exhibits the precision, recall and F1-score for the infected data points in both datasets:
Table 1: Precision, recall, and F1-score for the infected data points in both datasets

Further inspection on the dataset A and after consulting a professional specialist in this medical field, it turned out that the dataset is highly erroneous and misleading. The `notinfected` class which is supposed to represent the healthy ovaries having no sign of PCOS are in fact not images of ovaries at all. Rather, they are ultrasound images of uterus which completely falsify this dataset.
Conclusion:
Two experiments were conducted on two different datasets as called in this paper: Dataset A and Dataset B. Dataset A gave much better results but, it turned out that the dataset is highly erroneous and misleading. Therefore, data quality is of the utmost importance when training deep learning models, especially in the medical and health fields. The results of this study, show the ability of CNN and deep learning models in detecting the suspicious findings from the datasets. The DenseNet201 model not performing well on dataset B could be due to a variety of reasons such as the complexity of the ultrasound images or the relatively small number of data points available in the original dataset. To address this, the entire DenseNet201 model can be trained rather than freezing the feature extractor to perhaps produce better accuracy results on the test data of dataset B as training only the classifier seems to be not sufficient for this task. Also, experimenting with different learning rates and optimizers could yield more satisfactory results. However, the accuracy and reliability of the model’s predictions depend heavily on the quality of the data used to train it. If the data is flawed or biased, the model will likely produce inaccurate or unreliable results even if the results appear to be satisfactory. In the medical and health field, this can have serious consequences as it can lead to incorrect diagnoses or treatment recommendations, potentially causing harm to patients. Therefore, it is essential to ensure that the data used to train these models is of the highest quality and represents accurately the population intended to serve. This includes ensuring that the data is free from errors, and represents the target population, and has been collected using appropriate methods. Ensuring data quality is an ongoing process that requires continuous monitoring and improvement.
References :
The authors declare that they have no competing interests. Data and materials availability: All data are available in the main text.
Competing Interests :
(ISSN - Online)
2959-8591