INTRODUCTION
Discovery of phytoplasmas
Phytoplasmas, classified as wall-less and uncultivable bacteria, comprise a group of prokaryotic plant pathogens that inhabit the phloem of plant hosts as well as the salivary glands of the insects that act as their vectors [1, 2]. They were first identified when in 1967, Doi and co-workers discovered pleomorphic bodies in infected samples from mulberry trees and other plants that were infected by yellows diseases [3]. Previously, it had been believed that most yellowing diseases were caused by viruses because they were generally transmitted by insects, but many yellows-type diseases are now known to be caused by phytoplasmas [4]. The initial name of phytoplasmas was mycoplasma-like organisms (MLOs) due to ultrastructural and morphological similarities to mycoplasmas and because the mycoplasmas that cause diseases in humans and animals have similar sensitivity to tetracyclines. The name (MLOs) was used for phytoplasmas until 1994 [3] when the International Committee on Systematic Bacteriology (ICSB) sub-committee on the taxonomy of Mollicutes agreed to rename them as ‘Phytoplasmas’ to discriminate against them from other bacteria which belong to the class Mollicutes. Phytoplasmas were given this new name because of specific characteristics, such as their phytopathogenic properties, which do not exist in either mycoplasmas or other MLOs that inhabit phloem sieve tubes [5].
Morphology and genomic characteristics
The morphology of phytoplasmas is different from other bacteria and they have a range of sizes from 200 to 800nm and appear under an electron microscope as filamentous and pleiomorphic bodies [6] (Fig. 1). It has been suggested that there are filamentous forms of phytoplasmas and the reason for the phytoplasma size differences is that these represent different developmental stages in their plant hosts. In addition, their cell walls lack a rigid cell wall and have just a single unit cell membrane [6]. The genomes of Phytoplasmas are among the smallest in bacteria, between 530 kb and 1350 kb; the tomato strain of the stolbur phytoplasma and a Bermuda grass white leaf phytoplasma represent the largest and smallest genomes known [7]. Generally, the main reason for the limited studies of phytoplasma diseases has been the lack of ability to culture them in vitro, which may be related to their lack of essential genes, such as genes for biosynthesis of nucleotides, fatty acids, and amino acids [1, 9]. In addition, while most bacteria have a phosphotransferase system, which is important for phosphorylation and import of sugars (sucrose, fructose, and glucose), phytoplasmas do not have this system which makes them highly dependent on their plant hosts to get nutrients [10].
![Figure 1 Electron microscopy picture (6000x) of a cross section of sieve tubes with phytoplasmas, modified from [8].](https://journal.hcsr.gov.sy/wp-content/uploads/2023/11/1-9-300x199.png)
Pathogenicity of phytoplasmas
The study of phytoplasmas has been difficult because no reliable phytoplasma culturing has been accomplished in vitro, so that understanding of phytoplasma pathogenicity is limited. The majority of gene expression results and genome studies in vitro have been based on creating transgenic plants expressing phytoplasma genes in Nicotiana benthamiana or Arabidopsis thaliana. Evidence suggests two main factors affect phytoplasma pathogenicity: virulence factors and protein secretion.
Virulence factors
There are two main factors that appear to give the phytoplasmas their severity; the first factor is that several genes in phytoplasmas encode effector proteins that act directly on the host plant. The second is the side effects of phytoplasma infection [11]. For the first factor, a number of genes have been found in phytoplasmas that act as virulence factors and appear to be responsible for pathogenicity. For example, Bai et al [12] reported that the SAP11 protein, which is one of 56 secreted proteins by AY-WB phytoplasma (SAPs), contains a nuclear localization signal (NLS) and targets the nuclei of host cells, and also contains an N-terminal signal protein (SP). In addition, Sugio et al [13] reported that SAP11 expression increased in the AY-WB insect vector Macrosteles quadrilineatus offspring. For the second factor, and since phytoplasmas lack many important genes such as for metabolite synthesis and metabolic pathways, phytoplasmas must obtain many nutrients from their hosts and the depletion of nutrients from plants causes some of the symptoms of phytoplasma diseases [9]. Furthermore, the OY-W strain of the onion yellows phytoplasma has been shown to possess two glycolytic gene clusters which is a higher copy number than in the OY-M stain. It has been suggested that the harsh symptoms caused by the OY-W strain compared with the mild strain are because of the higher utilization of the carbon source resulting from possessing this increased number of glycolytic genes [9].
Protein secretion
When phytoplasmas are transmitted from diseased plants to healthy plants by insect vectors they enter inside the system of phloem cell cytoplasm [14]. After that, phytoplasmas start multiplying and secreting proteins inside the cytoplasm of phloem cells and some of these proteins are small enough in size to be able to move to other cells of the plant [10]. Phytoplasmas have two main systems to secrete proteins; the first system is called the Sec system for integrating and secreting proteins into cells of plant hosts, and the second one is the YidC system which is integrating membrane proteins [15].For the Sec protein secretion system, this system in Escherichia coli involves three stages; the first is called ‘targeting’, in which a protein is guided by the SecB protein and the signal-recognition particle (SRP) to exit locations in the membrane. The second stage is called ‘translocation’, in which the guided protein uses the action of the SecA, SecE and SecG proteins and nonessential subunits (SecD and SecF) to cross the lipid bilayer. The third stage is called ‘release’, in which the translocated protein is released and allowed to be natively folded in the periplasm or to proceed to the outer membrane for integration. It has been shown from whole genome sequencing of phytoplasmas, including Strawberry lethal yellows (SLY) [16], ‘Candidates Phytoplasma australiense’ strain PAa [17], ‘Candidatus Phytoplasma mali’ strain AT [18], ‘Candidates Phytoplasma asteris’ strain witches’ broom (AY-WB) [19], and ‘Candidates Phytoplasma asteris’ strain OY-M [20], that genes encoding SecA, SecE, and SecY are present in all five genomes. The YidC protein secretion system is also believed to be a common system in phytoplasmas, because the gene encoding the YidC protein has been found in all sequenced phytoplasma genomes [15]. Furthermore, a study conducted by Serek et al [21] revealed that in E. coli, YidC plays a crucial role in ensuring the precise insertion of newly synthesized membrane proteins into membranes. Additionally, it operates independently of the Sec-dependent protein machinery.
Classification of phytoplasmas
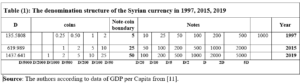
As phytoplasmas currently cannot be consistently cultivated in a laboratory setting, their classification remains a challenge. They are classified into the ‘Candidatus (Ca.) Phytoplasma (P.)’ taxon. In this system, if the similarity of the 16S rRNA gene is less than 97.5%, a new ‘Ca. P. species’ can be designated and separated from previously classified ‘Ca. P. species’. Sometimes, if there is a sufficiently different host range and/or insect vectors, a novel ‘Ca. P. species’ can also be created, even if the similarity of the 16S rRNA gene is more than 97.5% [22]. For additional information, and to get a clearer and deeper classification for closely related phytoplasmas, DNA sequences of other genes have been used, such as the spacer between the 16S and 23S rRNA, the ribosomal protein gene (rp), secA, secY and tuf genes [10, 23, 24]. Using the ‘Ca. P. species’ system, phytoplasma have been classified into thirty-three 16S rRNA groups [25-27]. Table 1 (supplementary) provides details of these 16Sr groups, including the name, geographic distribution, and strain/’Ca. P. species’.
Symptoms of phytoplasma diseases
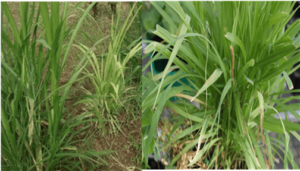
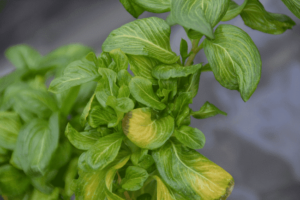
Symptoms in plants can depend on the season, pathogen species, and the stage of disease development, where different organs will exhibit different symptoms. In addition, a few plants can harbor phytoplasmas without showing any symptoms. Symptoms of diseased plants caused by phytoplasma infections include yellowish foliage (discolorations of leaves and shoots) (Fig. 2 and Fig. 3), shoot proliferation (witches’ broom) (Fig. 4), stunting (small leaves and shortened internodes), proliferation (growth of shoots from floral organs) and phyllody (the formation of leaf-like structures in place of flowers) (Fig. 5) [10]. As examples, aster yellows phytoplasma infected plants show witches’ broom symptoms throughout the plant or on flower stalks (Fig. 4), and most of the time only the symptoms on flowers are visible [28]. Elm yellows phytoplasma can cause several different symptoms such as witches’ broom, epinasty, leaf yellowing and decline of Eurasian species (Ulmus spp.) [29]. Napier grass stunt shows clear symptoms of phytoplasma infection on Napier grass plants, such as proliferation of tillers and shortening of internodes, little leaves, leaf yellowing, stunt and eventual death (Fig. 2) [30]. Sometimes the symptoms can be different or very hard to recognize because of complex interference between them and host physiology [31].
![Figure 3 Symptoms of Elm yellows phytoplasma on infected Ulmus americana showing yellowing leaves and epinasty compared with a healthy plant on the left side in the picture, modified from [32].](https://journal.hcsr.gov.sy/wp-content/uploads/2023/11/1-11-300x252.png)
![Figure 5 Depicts olive trees affected by phytoplasmas, showing shortened internodes, witches'-brooms, and smaller leaves (a), as well as hypertrophied inflorescences (b). This image has been adapted from [32].](https://journal.hcsr.gov.sy/wp-content/uploads/2023/11/1-13-e1701086953493-300x129.png)
Phytoplasma transmission and lifecycle
Transmission of phytoplasmas generally occurs from infected plants to healthy plants through insect vectors feeding on the phloem tissue of diseased plants. Insect vectors can be hoppers (Auchenorrhyncha, Homoptera) or psyllids (Sternorrhyncha, Homoptera) and transmission occurs in a persistent manner. The interactions between phytoplasmas and their insect vectors play a pivotal role in determining the host range of phytoplasmas [4]. Certain insect vectors have the ability to transmit multiple phytoplasma strains, and conversely, specific phytoplasmas can be transmitted by more than one vector. However, the mechanisms of insect vector-phytoplasma specificity or compatibility are not well understood [33].The life cycle of a phytoplasma begins with acquisition feeding, during which the phytoplasma enters the vector through the vector’s stylet while feeding. Subsequently, the phytoplasma traverses the insect’s intestine and is taken up into the hemolymph. Over the course of a few weeks following the initial feeding, it eventually migrates to the salivary gland. During these weeks, phytoplasmas keep multiplying until their concentrations reach a high enough level to be transmitted when the insects start feeding on healthy plants (inoculation feeding) (Fig. 6) [34].
![Figure 6 The life cycle of phytoplasmas is depicted with phytoplasmas represented as red dots. It commences with 'Acquisition Feeding,' during which an insect, like a leafhopper, acquires phytoplasmas while feeding. Following this, a 'Latency Period' ensues, indicating the time it takes for the phytoplasmas to reach an infection titer, necessary for their transmission. The final stage is 'Infection Feeding,' during which the insect transmits phytoplasmas to healthy plants as it feeds, modified from [37].](https://journal.hcsr.gov.sy/wp-content/uploads/2023/11/2-300x199.jpg)
Furthermore, in certain combinations of insect vectors and phytoplasmas, it has been observed that transovarial transmission occurs. This means that the phytoplasma can be passed from parent insect vectors to their offspring. An example of this phenomenon is observed in the case of the leafhopper Matsumuratettix hiroglyphicus and the sugarcane white leaf phytoplasma [35], and the leafhopper Hishimonoides sellatiformis and mulberry dwarf phytoplasma [36]. It is also possible for phytoplasmas to be transmitted by the parasitic plant, dodder (Cuscuta spp.), in experimental conditions. Once dodder plants start growing on infected plants, phytoplasmas enter inside the dodder plant through haustoria and proliferate within the dodder plant, and then move to healthy plants via haustoria of dodder [38]. As an example, European stone fruit yellows, pear decline, and various other phytoplasmas have been intentionally transferred from naturally infected plants to healthy periwinkle plants (Catharanthus roseus) through the use of dodder plants in experimental studies [39]. Přibylová et al [40] reported that dodder plants transmitted RG phytoplasma successfully from infected Rehmannia glutinosa plants to healthy periwinkle plants. In experimental settings, grafting is another method employed for the transmission of phytoplasmas and the maintenance of infected plants. This process involves transferring phytoplasmas from naturally infected plants to healthy ones, often using periwinkle plants as the healthy host. For instance, phytoplasmas have been successfully transmitted from infected grapevines to healthy periwinkle plants through a grafting technique known as wedge grafting [41], and chip and bark grafting has been used to transmit the apple proliferation (AP) phytoplasma from infected apple plants to healthy periwinkle plants [42]. However, grafting has not been successful for all phytoplasmas, and other transmission methods sometimes need to be used. Furthermore, phytoplasmas can also be transmitted through vegetative propagation methods, including storage tubers, cuttings, bulbs, or rhizomes [24].
Phytoplasma diagnostics
The detection of phytoplasmas presents challenges due to their uneven distribution within infected plants and, particularly in woody hosts, their typically low concentration. Historically, researchers attempted various techniques for phytoplasma detection, including grafting onto indicator hosts, electron microscopy observations, and the use of DNA-specific dyes to stain the pathogen’s nucleic acid. However, these approaches often yielded unreliable results. Over the last two decades, the focus in phytoplasma detection has shifted primarily towards serology and, more frequently, nucleic acid-based techniques like PCR (Polymerase Chain Reaction). PCR is employed to amplify specific regions of the phytoplasma genomes that are present within infected plants. Notably, routine diagnostics have evolved from traditional PCR to real-time PCR. This transition has been driven by its enhanced sensitivity and reduced risk of contamination, thanks to the use of a closed system for product detection. Additionally, this method can be adapted for semi-quantitative analysis, further improving its utility in phytoplasma detection and monitoring [43]. Indeed, DNA extraction typically serves as the initial step in diagnosing phytoplasma infections, and many protocols are reported for DNA extraction from potentially infected plants and vectors. Each protocol is different from another and depends on sampling procedures and on the species of plant host/insect or condition of storage in which the collected samples were placed [44-47].
Serological assays
Enzyme-linked immunosorbent assays (ELISA) are one serological method that has been used, but it is rarely used because of the limitations in specificity and sensitivity compared with nucleic acid-based assays. A commercial monoclonal anti-IgG kit-based DAS-ELISA has been developed, but it was unable to detect all ‘Ca. P. mali’ [25].
Nucleic acid-based assays
Polymerase chain reaction
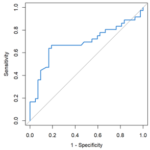
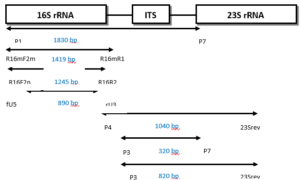
Over the past two decades, the predominant focus in phytoplasma detection research has shifted towards the utilization of nucleic acid-based techniques, particularly Polymerase Chain Reaction (PCR). Researchers have tried to obtain sequences of specific regions of phytoplasma DNA and design primers for these regions. Some of the design involved specific primers for a particular group, but most were trying to design universal or semi universal primers to detect all groups of phytoplasma or most of these groups, of which there are at least thirty-three 16S rRNA groups [4, 27]. Ribosomal RNA primers are one of the sets of universal primers that are generally used to detect phytoplasmas and amplify a specific fragment of phytoplasma DNA (16S rRNA gene). Because of the low concentration of phytoplasma DNA, most laboratories use universal primers in the first round of PCR reactions and then use another internal primer (second round) which is often more specific (nested PCR). There are also ‘universal primers’ for other genes such as the rp (ribosomal operon), secA, tuf, secY, hlg, gyr, and nitroreductase genes [34, 48, 49].Practically, a first round PCR (direct PCR) is performed with a pair of primers, then followed by a second pair of primers which targets primer sites on first round PCR products. Second round PCR assays are created which increase sensitivity and specificity of the diagnosis compared to first round PCR. Figure 7 shows an example of first round and nested PCR primers for the 16S rRNA gene or the spacer region between 16S rRNA and 23S rRNA [50]. From the spacer region (rRNA operon), it is also possible to design specific, semi universal and universal primers. In addition, other genes have been used to obtain high specificity of assays and distinguish between closely related phytoplasma strains, such as ribosomal operon (rp), secA, secY, tuf [34, 51, 52]. Moreover, PCR products can be sequenced and compared against reference phytoplasma sequences on the NCBI database.
Terminal restriction fragment length polymorphism (T-RFLP):
T-RFLP is a technique that has been adapted for the identification of phytoplasmas within their host organisms, including plants and vector insects, as well as for categorizing them into specific phylogenetic groups. In this approach, a fluorescent tag is attached to one of the PCR primers. Subsequently, after performing PCR and enzymatic digestion with a suitable enzyme, the focus is on analyzing the size of the terminal restriction fragment (TRF) that contains the labelled primer. This analysis is typically conducted using automated DNA sequencing equipment [34].
Real-time PCR:
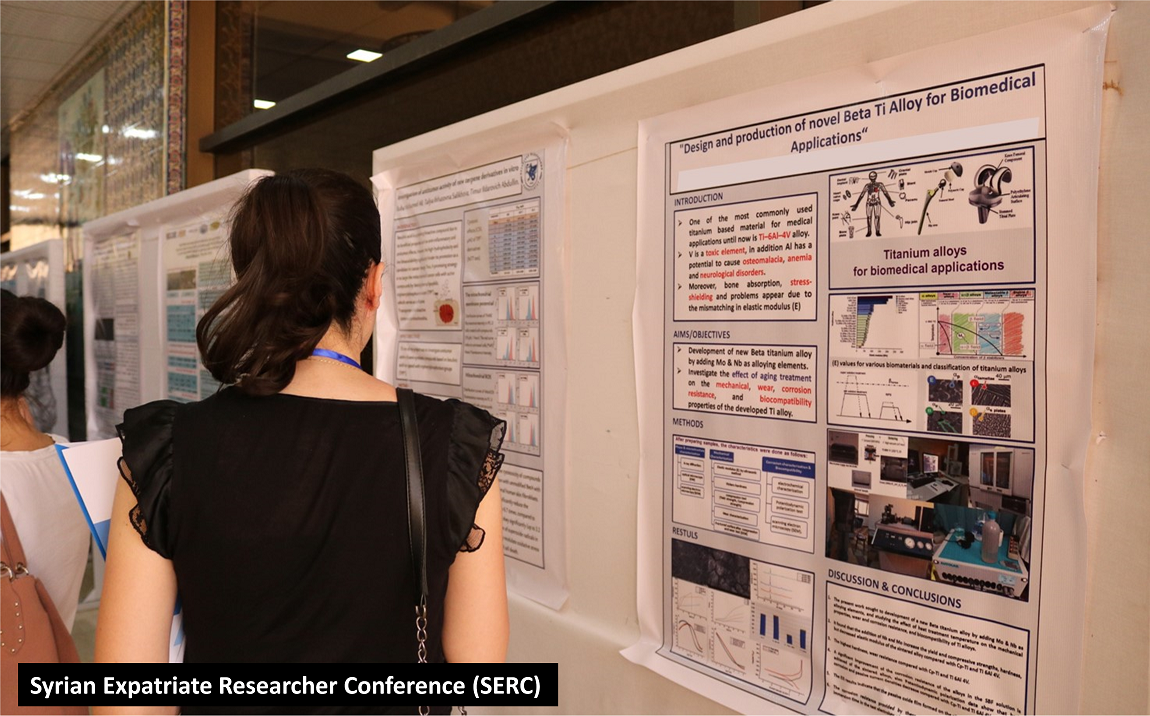
Increasingly, there are new methods to diagnose phytoplasmas, but improvements in diagnostics are needed to produce methods that are more economic, quicker and more robust [53]. Sensitivity of nested PCR protocols is high, but the problem with nested PCR is to obtain high levels of sensitivity without the risk of false positive results due to contamination of samples during the various procedures and opening of tubes [14]. In the last few years, real time PCR (qPCR) which has been used wildly as a tool for phytoplasma diagnosis, replaced standard PCR because of direct reading and high sensitivity of the result. A key characteristics of qPCR is that gel electrophoresis is not needed, which reduces the risk of sample contamination [52, 53].To use qPCR for phytoplasma diagnosis, there are two alternative systems, the first system using SYBR Green [54], and the second uses TaqMan probes [55].The SYBR Green system requires a binding dye for double-stranded DNA, and during qPCR cycles the dye can be detected when it binds double stand qPCR products. The way the SYBR GREEN assay works is as follows. While PCR is happening, PCR products are created because the DNA polymerase amplifies the target sequences. Once the dye is added, it immediately binds to any matched double-stranded DNA and fluoresces. Therefore, every new copy of DNA generated will bind, and as more amplification occurs the fluorescence intensity increases. This can be used as a measure of the amount of product [56].The SYBR-GREEN assay offers several advantages, including its ability to monitor the amplification of any double-stranded DNA sequences without the need for specific probes. This feature helps reducing the overall costs associated with assay setup. However, it comes with a disadvantage: because the SYBR-GREEN dye can bind to any double-stranded DNA, including both target and non-target DNA, there’s a risk of generating false positive signals. Therefore, to ensure accuracy in results, it becomes crucial to carefully design primers that enhance the specificity of SYBR-GREEN assays. Additionally, it’s essential to validate qPCR reactions through melt curve analysis as part of quality control measures [56, 57].
![Figure 8 How the SYBR GREEN assay works step by step, modified from [56].](https://journal.hcsr.gov.sy/wp-content/uploads/2023/11/1-16-259x300.png)
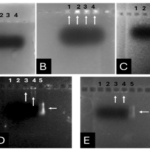
In the TaqMan system and instead of using binding dyes, probes and reporter dyes are used. Probes encode from 5’ to 3’ to target a specific site between a forward qPCR primer site and a reverse qPCR primer site. During cycles of TaqMan reactions, primers start amplifying the DNA target, then probes bind the qPCR products, and the reporter dye is freed from the quencher and detected by the instrumentation of qPCR [58, 59]. In Taqman assays, the probe typically incorporates a fluorescent reporter dye at its 5′ end and a quencher dye at its 3′ end. When the target DNA is introduced, the probe binds downstream from one primer site and becomes susceptible to cleavage by the 5′ end of the Taq DNA polymerase as it extends the primer. During this cleavage step, the reporter dye separates from the quencher dye, resulting in an increased signal emitted by the reporter dye. Once the probe has been cleaved from the target DNA, the primers can continue extending along the template strand until they reach the end. This ensures that the probe does not impede the overall PCR process. During each cycle of PCR, the reporter dye molecules are cleaved from their respective probes, leading to a rise in fluorescence intensity that is directly proportional to the amount of amplicon produced. This fluorescence signal provides a quantitative measure of the target DNA in the sample (see Fig 9) [60].
![Figure 9 How Taqman assays work step by step, modified from [61].](https://journal.hcsr.gov.sy/wp-content/uploads/2023/11/2-1-260x300.jpg)
TaqMan assays have been developed as universal assays and assays for a number of 16Sr groups (Fig. 9) [14]. In addition, SYBR Green assays have also been developed especially for apple proliferation (AP), bois noir, and flavescence dorée phytoplasmas, and other universal assays to detect phytoplasmas in groups 16SrV, 16SrX, and 16SrXII. When comparing SYBR Green systems to other techniques of phytoplasma detection such as the TaqMan system and conventional nested PCR, the SYBR Green system can give rapid and specific detection of the DNA target of phytoplasmas. For example, assays have been developed to early detection of quarantine phytoplasmas quantitatively, for example ‘Ca. P. pyri’, ‘Ca. P. mali’, and ‘Ca. P. prunorum’ (members of 16SrX group) affecting fruit trees [14].
Loop-Mediated Isothermal Amplification (LAMP):
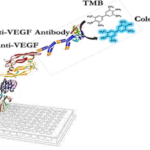
Recently, the LAMP technique (Loop-Mediated Isothermal Amplification) has been used a lot for phytoplasma detection because it is easy to use and takes a very short time to get the results. This technique amplifes DNA targets under isothermal conditions, and generally uses a set of six primers for each assay (external primers, internal primers, loop primers) and a DNA polymerese with strand displacement activity (Fig. 10). Results of amplifications generally take less than an hour, and can be observed by agarose gel, hydroxyl napthol blue colorimetric assays, or intercalating fluorescent dyes performed in instruments for real-time PCR or LAMP [43, 62, 63]. For example, LAMP assays for two different specific phytoplasma groups have been published; from 16SrI group (aster yellow phytoplasma) and from 16SrXXII group (Cape St. Paul wilt). Sensitivity of these assays was compared to nested PCR, and assays were specific for target DNA phytoplasma [62]. Additional LAMP assays have been developed and documented for the detection of phytoplasma groups 16SrII and 16SrXII in various fruits and weeds found within the Ethiopian Rift Valley. These assays provide valuable tools for identifying and monitoring phytoplasma infections in agricultural and natural ecosystems in this region [43, 63].
How Loop-mediated Isothermal Amplification works:
1. The F2 region (part of FIP primer) hybridizes to region of F2c (part of target DNA) and initiates complementary stand synthesis.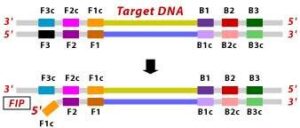 2. Similarly, with external primer F3 primer hybridizes to the F3c to the F3c (part of the target DNA) and extends; this leads to the removal of the FIP-linked complementary stand. Those removed stand forms will make a loop at the 5’ end.
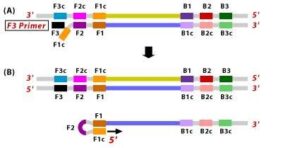 3. The DNA with a loop at 5’ end becomes a template for BIP, and the same process will happen with B2 and B2c, with hybridization between the B2 region and B2c region of the template DNA.
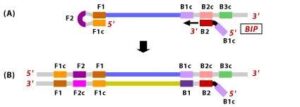
4. External primer B3 hybridises to B3c (from target DNA) and then extends, leading to removal of the BIP linked complementary stand. These results in the information of dumbbell sharped DNA.
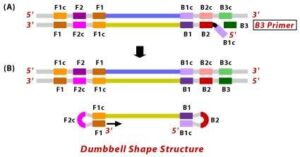
5. DNA polymerase adds nucleotides to the 3’ end to F1, and extends to open the loop at the 5; end. The dumbbell shaped DNA now gets converted to a stem-loop structure and this structure will be useful in the second stage of the LAMP reaction as an initiator for LAMP cycling.

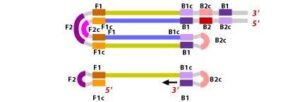
6. During the cycling of Loop-Mediated Isothermal Amplification (LAMP), the Forward Inner Primer (FIP) hybridizes to the stem-loop DNA structure. At this stage, strand synthesis is initiated. Importantly, as the FIP hybridizes to the loop region of the DNA, the original F1 strand is displaced and re-forms as a new loop at the 3′ end of the DNA molecule. This strand displacement activity is a key feature of LAMP and contributes to the exponential amplification of the target DNA.
7. In the next step, the DNA polymerase adds nucleotides to the 3′ end of the B1 region and extends it, which results in the removal of the Forward Inner Primer (FIP) strand. This newly synthesized strand, like before, assumes a dumbbell-shaped DNA structure. Following this, self-primed strand displacement DNA synthesis occurs, leading to the formation of two distinct structures: one complementary to the original stem-loop DNA and another one where any gaps in the structure are repaired, resulting in a stem-loop DNA with no gaps. This process continues as the DNA amplification cycle proceeds in Loop-Mediated Isothermal Amplification (LAMP).
8. After the initial amplification cycle, the two distinct products generated serve as templates for a Backward Inner Primer (BIP) primed strand displacement reaction in the subsequent cycles. This means that with each cycle of LAMP, the target sequence is exponentially amplified. In fact, the amplification rate is so efficient that the target DNA is typically amplified around 13-fold with each half-cycle of LAMP, resulting in a rapid accumulation of DNA copies.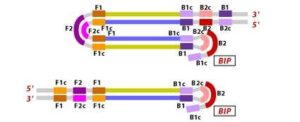
![Figure 10 Illustration depicting the operational principle of LAMP assays, involving a set of six primers that consist of external primers (F3 and B3), internal primers (FIP and BIP), and loop primers (loopF and loopB), modified from [64].](https://journal.hcsr.gov.sy/wp-content/uploads/2023/11/2-9-300x92.jpg)
The benefits of isothermal amplification techniques include their independence from thermal cycling, simplifying operation, and their lower energy requirements compared to PCR methods, which involve rapid heating and cooling steps. Consequently, it becomes feasible to create compact, battery-powered portable devices. Moreover, in real-time LAMP methods, and similar to real-time PCR, the entire process takes place within sealed tubes, minimizing the potential for sample contamination [65].
Phytoplasma genomics
In the last decade, four phytoplasma genomes have been completely sequenced; ‘Ca. P. asteris’ strains OY-M [20], AY-WB (aster yellows witches’-broom) [19], ‘Ca. P. mali’ strain AT [18] and ‘Ca. P. australiense’ strain PAa [17], and two others have good coverage that is publically available (strawberry lethal yellows SLY) [16], or have been sequenced at the University of Nottingham (Napier grass stunt NGS)[66].
Genome features
According to these genome studies, phytoplasmas SLY, PAa, OY-M, and AY-WB have the larger genome sizes, which are in the order of 960, 880, 853, and 706 kbp. Phytoplasmas AT and NGS have smaller genome sizes of approximately 602 and 484 kbp. Generally, the G+C contents in the phytoplasmas are low; it is from 20.4% to 27.8%. From these six sequenced genomes the NGS has the lowest G+C content which is 20.4%, followed by the AT genome (21.3%), AY-WB genome (26.9%), SLY genome (27.2%), PAa genome (27.4%), and OY-M genome (27.8%). Interestingly, whilst most phytoplasma genomes appear to be circular, that of AT and possibly NGS are linear. The genomes have variable numbers of transfer RNA genes (from 31 to 35), but all of them have two ribosomal RNA operons. Furthermore, four plasmids are found in the genome of AY-WA, two plasmids are found in the genome of OY-M, and one plasmid is found in the genome of PAa and NGS [17-20].
Potential mobile units
Potential mobile units (PMUs) are repetitive genes that are organized in units of approximately 20 kbp, and they are found in many phytoplasma genomes. These PMUs look like composite replicative transposons, and some are associated with putative ‘virulence genes’ and contain several genes for recombination [67]. For example, aster yellows strain AY-WB has four different PMUs including PMU1, PMU2, PMU3, and PMU4. PMU1 is the largest unit at approximately 20 kbp, and the rest of the PMUs have similar gene structures to PMU1, but are smaller. Additionally, PMU1 in AY-WB strain is linear [19, 68]. Up to now, PMUs are regions that have been found and studied in phytoplasma genomes such as ‘Ca. P. asteris’ strain OY-M, ‘Ca. P. australiense’ strains PAa and SLY, and ‘Ca. P. mali’ strain AT. But it is still unclear whether Potential Mobile Units (PMUs) are present in all phytoplasma genomes. The presence of PMUs can vary among different phytoplasma strains and species. While PMUs are commonly found in many phytoplasma genomes and play a role in their genetic diversity and adaptation, the specific distribution of PMUs across all phytoplasma genomes remains an area of ongoing research. Scientists continue to study the genomes of various phytoplasma strains to gain a better understanding of the prevalence and diversity of PMUs in this group of microorganisms [69, 70].
Management and control of phytoplasmas
The primary approach to manage phytoplasmas involves the application of insecticides to regulate the insect vectors responsible for transmission. However, even with the extensive utilization of insecticides, phytoplasma diseases continue to inflict significant damage in numerous countries across the globe [71]. Furthermore, since the usage of chemical control is limited and being reduced worldwide (because of the other effects of chemical materials on humans, plants, animals, and the environment) other approaches are required. In addition, agricultural intensification and climate change are expected to raise insect vector populations, which may lead to more phytoplasma-related yield losses in the future. From current research there is evidence that phytoplasma diseases are becoming widespread worldwide and spreading into new host plants [72].Since antibiotics are too expensive and not a successful or practical strategy for long-time control, using them is not recommended for control of phytoplasmas. In an interesting study from 1985, Dickinson and Townsend, noticed from research on spiroplasmas, which are a group related to plant pathogenic Mollicutes, that remission of symptoms occurred during introduction of specific secondary isolates, with indications that this was because of the presence of lysogenic phages in certain isolates of spiroplasmas. Furthermore, there is evidence that when two different strains of phytoplasmas are mixed together to infect a healthy plant host, some strains can out-compete others. This evidence could be useful for developing the idea of using mild strains as a means of controlling some diseases [73]. Recent experiments at the University of Nottingham have shown that inclusion of two different strains of phytoplasma into healthy periwinkle plants at the same time (RG+SPLL and RG+EY), can result in symptoms that belong to only one 16Sr group (RG) appearing on plants after 4-6 weeks. Following by DNA-extraction and then testing the samples by qPCR and LAMP techniques, researchers confirmed that the RG phytoplasma was detected at a higher titer than others, which indicates that RG phytoplasma is able to outcompete the SPLL and EY phytoplasmas [63, 66]. Additional strategies employed to combat phytoplasma diseases include rouging, which entails the prompt removal of diseased or infected plants once symptoms become evident (or as soon as phytoplasmas are identified through molecular detection methods) [74]. In addition, certification, which is a procedure where commercial production and nursery stocks undergo official regulation by competent government agencies for securing absence from phytoplasma diseases, can be used to prevent phytoplasma spread both within and between countries [74].


 Our results also show that there are many obstacles that prevent the success of the interlinking between the SRBs and PSBs, the most important of which is the lack of institutionalization of the interdependence process among them.
 Source: