logo

Design, Expression, and Inhibitory Effects of Antagonistic Single-Chain Platelet-Derived Growth Factor on Lung Cancer Cells

INTRODUCTION

Growth factors assume crucial roles in regulating cell proliferation, growth, and differentiation under both physiological and pathological conditions. One such pivotal factor is the platelet-derived growth factor (PDGF), which participates in various physiological activities. PDGF contributes to the differentiation of embryonic organs, facilitates wound healing processes, regulates interstitial pressure within tissues, and plays a key role in platelet aggregation. The multifaceted involvement of PDGF underscores its significance in maintaining homeostasis and responding to dynamic cellular processes in health and disease (1, 2). PDGF is a dimeric polypeptide, each monomer weighing approximately 30 kDa and consisting of nearly 100 amino acid residues. Five isoforms of PDGF exist, denoted as AA, BB, CC, DD, and AB. These isoforms act as activators of the PDGF receptor (PDGFR), which is present in two isoforms, PDGFR-α and PDGFR-β. The activation process involves receptor homo- or hetero-dimerization, leading to the induction of autophosphorylation on specific tyrosine residues located within the inner side of the receptor. This autophosphorylation event triggers the activation of kinase activity, initiating the phosphorylation of downstream proteins (3). The ensuing phosphorylation cascade orchestrates the effects of the PDGF signaling pathway (4). PDGF is involved in a number of malignant and benign diseases, including glioblastoma multiforme (GBM) (5), meningiomas, chordoma, and ependymoma (6, 7). Additionally, PDGF plays a role in skin cancer, specifically dermatofibrosarcoma protuberans (DFSP) (8), gastrointestinal tumors (GIST), synovial sarcoma, osteosarcoma , hepatocellular carcinoma, and prostate cancer (3, 9). Aberrantly elevated levels of PDGF receptor and/or PDGF have been observed in lymphomas and leukemias, including chronic myelogenous leukemia (CML) (10), acute lymphoblastic leukemia (ALL), chronic eosinophilic leukemia (CEL), and anaplastic large cell lymphoma (11, 12). Moreover, such abnormal upregulation has been noted in other cancer types, such as breast carcinoma, sarcomatoid non-small-cell lung cancer, and colorectal cancer (13). These findings underscore the potential role of dysregulated PDGF signaling in the pathogenesis of these hematologic and solid malignancies, suggesting its relevance as a target for further therapeutic exploration. PDGF exerts its influence not only in malignant diseases, but also in non-malignant conditions, extending its influence to fibrotic diseases such as kidney, liver, cardiac, and lung fibrosis. Additionally, PDGF plays a role in various vascular disorders, including systemic sclerosis, pulmonary arterial hypertension (PAH), endothelial barrier dysfunction, proliferative retinopathy, cerebral vasospasm, and cytomegalovirus infection (14, 15). The broad spectrum of PDGF involvement highlights its significance in the context of diverse pathological processes, emphasizing its potential as a therapeutic target in addressing both malignant and non-malignant disorders. Inhibition of the PDGF signaling pathway holds significant therapeutic potential for both malignant and non-malignant diseases. Various strategies have been devised to impede this pathway, including the utilization of monoclonal antibodies targeting PDGF or PDGFR. These antibodies specifically obstruct the PDGF signaling pathway by binding to PDGF or PDGFR, thereby preventing receptor dimerization (16, 17). Alternatively, small molecule inhibitors of receptor kinases present another strategy, although they may lack specificity and inadvertently inhibit other signaling pathways (18). Another approach involves the use of soluble receptors that compete with PDGFR for binding to the ligand, thereby preventing the interaction between PDGF and its receptor. Furthermore, DNA aptamers, oligonucleotides that bind to PDGF and hinder its interaction with its own receptor, represent an additional avenue for therapeutic intervention (19). These diverse strategies offer a range of options for modulating the PDGF signaling pathway with the aim of treating various diseases. Imatinib, a tyrosine kinase inhibitor that effectively impedes the PDGF pathway, has been approved for the treatment of chronic myelogenous leukemia (CML), acute lymphoblastic leukemia (ALL), chronic eosinophilic leukemia (CEL), gastrointestinal stromal tumors (GIST), and dermatofibrosarcoma protuberans (DFSP). Another PDGFR-selective inhibitor, CP-673451, has demonstrated inhibitory effects on the proliferation and migration of lung cancer cells. Moreover, CP-673451 has exhibited the capacity to enhance the cytotoxicity of cisplatin and induce apoptosis in non-small cell lung cancer (20). In a phase II trial, Olaratumab®— (a human anti-PDGFR-α monoclonal antibody)-displayed an acceptable safety profile in patients with metastatic gastrointestinal stromal tumors (21). These instances underscore the therapeutic potential of targeting the PDGF pathway for the treatment of various malignancies. In this investigation, we focused on the design and construction of a single-chain PDGF receptor antagonist. This antagonist was strategically engineered such that one of its two poles retained the capability to bind with the receptor while the other pole lacked this ability. The intended outcome was to impede receptor dimerization, thereby inhibiting the PDGF signaling pathway. This inhibitory effect is achieved by displacing specific amino acid residues within PDGF BB that play a crucial role in the interaction between PDGF and its receptor. This targeted interference was informed by a meticulous analysis of the structure of the receptor-ligand complex, as illustrated in Scheme 1.
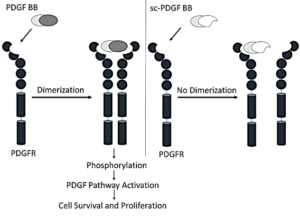
Scheme 1. Mechanism of Designed Single-Chain Antagonistic PDGF, which binds to one monomer PDGFR, prevents dimerization of receptors and therefore inhibits the PDGF signaling pathway.

MATERIALS AND METHODS

Materials

Isopropyl β-D-1-thiogalactopyranoside (IPTG) and kanamycin were procured from Invitrogen (Carlsbad, CA, USA). Nickel-nitrilotriacetic acid (Ni-NTA) affinity chromatography resin was supplied by Qiagen (Hilden, Germany). A 96-Well plate, specifically Max-iSorp, was provided by Nunc (USA). Oxidized glutathione was purchased from AppliChem (USA), while reduced glutathione was acquired from BioBasic (Canada). (3-(4,5-dimethyl thiazolyl-2)-2,5-diphenyltetrazolium bromide) MTT was obtained from Sigma (USA). Escherichia coli strain BL21 (DE3) was procured from Novagen (Madison, WI, USA) and New England Biolabs Inc. (Beverly, MA, USA), respectively. Cell culture medium was sourced from Bioidea Company (Tehran, Iran), and fetal bovine serum was acquired from Gibco/Invitrogen (Carlsbad, CA, USA). A549 cells were obtained from the American Type Culture Collection (ATCC; Manassas, VA, USA). All other chemicals used in the study were obtained from Merck (Darmstadt, Germany). YASARA software version 14.12.2 was employed for visualizing protein figures.

Design of PDGF Antagonist

The crystal structures of the PDGF-PDGF Receptor complex (PDB ID: 3MJG) were obtained from the Protein Data Bank (PDB), ensuring a reliable foundation for subsequent analyses. The CFinder server (http://bioinf.modares.ac.ir/software/nccfinder/) was used to identify the residues that are critical in the interaction between PDGF and PDGFR that cause receptor dimerization.

Residue Analysis and Replacement Strategy

For a detailed exploration of the residues engaged in protein-protein interactions within the PDGF-PDGF Receptor complex, the CFinder server was employed. This computational tool utilizes the protein complex PDB file as input, relying on accessible surface area differences (delta-ASA) to identify residues that contribute to ligand-receptor interactions. Subsequently, to facilitate the replacement of PDGF segments involved in binding to PDGFR, peptide segments with comparable geometry but distinct physicochemical properties were selected.

Protein Design and Fragment Replacement Strategy

The ProDA (Protein Design Assistant) server (http://bioinf.modares.ac.ir/software/proda) was instrumental in this process (22). This server aids in the identification of peptide segments suitable for substitution, ensuring the maintenance of structural integrity while introducing variations in physicochemical characteristics. This integrated approach, combining CFinder and ProDA servers, enhances our understanding of the intricate molecular interactions within the PDGF-PDGF Receptor complex and guides the design of the single-chain PDGF receptor antagonist with targeted modifications for disrupting receptor dimerization. The ProDA (Protein Design Assistant) web server, integral to our study, provides a comprehensive list of diverse protein segments by querying a database using specified input parameters. The criteria employed in the search encompass the number of amino acid residues, amino acid sequence patterns, secondary structure, distance between fragment ends, as well as the polarity and accessibility patterns of amino acid residues. The selection of suitable fragments is meticulously carried out based on several considerations, including amino acid content and specific characteristics such as secondary structure features, polarity, and accessibility patterns. These selected fragments from the candidate sequences are then strategically chosen for replacement within the PDGF BB sequence. This sophisticated approach, combining criteria-driven segment selection with subsequent integration into the PDGF BB sequence, ensures a thoughtful and targeted modification strategy in the design of our single-chain PDGF receptor antagonist.

 Linker Design and 3D Structure Construction

To optimize purification and refolding processes while minimizing interference with the three-dimensional structure of the single-chain PDGF (sc-PDGF), an 18-amino acid residue linker was meticulously designed. This linker serves as a critical bridge between the two monomers of PDGF BB. Subsequently, the three-dimensional structure of the modified PDGF was constructed based on its primary sequence. The MODELLER software (version 9.17) (23) was employed for this purpose, generating a pool of 100 models. The model selection process involved choosing the model with the lowest MODELLER objective function score, indicating the best structural fit. To ensure the structural integrity and quality of the selected model, stereochemistry checks were performed using PROCHECK software (24). This rigorous validation step guarantees the reliability and accuracy of the constructed 3D structure, which is essential for subsequent analyses and experimental applications.

 Molecular Dynamics Simulations

Molecular dynamics (MD) simulations were conducted employing GROMACS 5.0.7, focusing on both the modeled single-chain PDGF (sc-PDGF) and the native isoform. The simulations spanned a duration of 20 nanoseconds, utilizing the Gromos96 force field (25). The structure was solvated in a solvation box using a simple point-charge water model (26), with a minimum distance of 10 Å between the protein and the edges of the box. The system was neutralized by adding Cl– and Na+ ions that were randomly replaced with water molecules. The system was initially relaxed, and any bad contacts between atoms were removed through the steepest descent algorithm in an energy minimization step. The minimized systems were then equilibrated for 100 picoseconds (ps) using canonical and isothermal–obaric ensembles. The simulations were performed at 300 K and 1 bar. Finally, the equilibrated systems were simulated for a period of 20 nanoseconds (ns) with a 2-femtosecond (fs) time step to determine the possible effects of modification on the structure of sc-PDGF. The Root Mean Square Deviation (RMSD) and radius of gyration of the system were investigated and evaluated to determine the stability of the MD simulations and the compactness of the sc-PDGF during the simulations.

Molecular Docking Analysis

To assess the binding capabilities of both the native and modified PDGF with PDGFR, molecular docking simulations were conducted using the ClusPro server (https://cluspro.org) (27). Molecular Docking was performed with a monomeric receptor, and the ability of native/ modified PDGF to bind to the receptor was evaluated depending on the ClusPro score, and the results of Docking were evaluated.

Construction, Expression, Refolding, and Purification of Antagonistic PDGF

The PDGF antagonist-encoding gene was synthesized and subsequently cloned into the pET28a expression vector, flanked by BamHI/XhoI restriction sites. This molecular construct was facilitated by Shine Gene Molecular Biotech, Inc. (Shanghai, China). The steps involved in the construction, expression, refolding, and purification of the PDGF antagonist are detailed below:

Gene Cloning and Transformation

The synthesized PDGF antagonist-encoding gene was cloned into the pET28a expression vector, which was then transformed into Escherichia coli BL21 (DE3) cells.

Expression Conditions

The transformed cells were induced for expression at 37 °C, with 0.5 mM isopropyl β-D-1-thiogalactopyranoside (IPTG) for 6 hours.

Inclusion Body Collection and Dissolution

Inclusion bodies containing the expressed PDGF antagonist were collected and dissolved in 6 M urea.

Purification and Refolding

Purification and refolding were conducted using a previously described protocol (28). Column chromatography was employed with sequential elution using buffers A, B, C, D, and E respectively;

Buffers A: 6 mol/L urea, 0.5 mol/L NaCl, 10% glycerol, 1% TritonX-100, 20 mM Tris, pH 6.5.

Buffers B: 6 mol/L urea, 0.5 mol/L NaCl, 10% glycerol, 1% TritonX-100, 20 mM Tris, pH 5.8.

Buffers C: 4 mol/L urea, 0.5 mol/L NaCl, 6% glycerol, 20 mM Tris, 2 mM reduced glutathione (GSH), pH 8.0.

Buffers D: 2 mol/L urea, 0.5 mol/L NaCl, 3% glycerol, 20 mM Tris, 2 mM GSH, 0.2 mM oxidized glutathione (GSSG), pH 8.0.

Buffers E: 0.5 mol/L NaCl, 20 mM Tris, 2 mM GSH, 0.5 mM GSSG, pH 8.0. The elution buffer contained 300 mM imidazole and 0.5 mol/L NaCl.

Elution and Gel Analysis

The eluted modified PDGF was collected in sterile vials. The collected fractions were loaded onto an electrophoresis gel for further analysis. This detailed procedure outlines the steps taken to construct, express, and purify the modified PDGF antagonist, ensuring its structural integrity and functionality for subsequent experiments.

Circular Dichroism Measurement

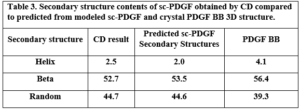
CD spectra were performed using a spectropolarimeter (Jasco J-715, Japan) at the far-UV wavelength of 195-240 nm (sc-PDGF concentration was 0.1 mg/ml in phosphate saline buffer), to confirm that the secondary structures of refolded sc-PDGF were not significantly changed. The data were smoothed by the Jasco J-715 software to reduce the routine noise and calculate the secondary structure percentage of antagonistic PDGF. The results were reported as molar ellipticity [θ] (deg cm2.dmol-1), based on a mean amino acid residue weight (MRW) of sc-PDGF. The content of secondary structures of sc-PDGF was obtained and compared to those of modeled sc-PDGF and the crystal structure of native PDGF BB. 

Growth Inhibition Assay

The inhibitory activity of modified PDGF was studied on adenocarcinomic human alveolar basal epithelial cells (A549). The cells were cultured in DMEM with 10% FBS and incubated in 5% CO2 at 37 °C. For growth inhibition assay, cells were collected by washing with PBS, added trypsin, then counted and 6000 cells/well were seeded in a sterile 96-well plate. After 24 h, the medium was replaced with fresh medium containing different concentrations of modified PDGF. The cells were incubated for 24 h at 37 °C. Afterward, cell growth inhibition was analyzed using the MTT assay. 10 µl of 5 mg/ml MTT solution was added to each well and the plates were incubated for 3-4 h at 37 °C. After that, the media were replaced with 100 µl of DMSO (dimethyl sulfoxide), and the absorbance of the wells was measured at 570 nm using a µQuant microplate reader (BioTek, USA) (29).

RESULTS

  • Designing of PDGF Antagonist

The design of the PDGF antagonist was informed by an analysis of accessible surface area (ASA) differences, identifying critical peptide segments and amino acid residues in PDGF BB involved in receptor binding. The fragments exhibiting the highest delta-ASA were recognized as crucial in the binding process to the receptor. Specifically:

       1. In PDGF (subunit I):   Fragments 13IAE15, 54NNRN57, and 98KCET101 were identified as essential for binding to the receptor (Figure 1A).

  1. In PDGF (subunit II): Fragments 27RRLIDRTNANFLVW40, and 77IVRLLPIF84 were recognized as critical for binding to the receptor (Figure 1B).

Based on these findings, strategic replacements were decided upon in four important regions (Figure 1C):

  • E15 with K in PDGFB monomer I
  • Fragment (54 NNRN 57) with (ADED) in PDGFB monomer I
  • Fragment 25-43 changed to LIRPPIC in PDGFB monomer II
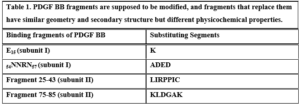
  • Fragment 74-85 changed to KLDGAK in PDGFB monomer II (Table 1).

In the design of the single-chain PDGF (sc-PDGF), a linker sequence VGSTSGSGKSSEGKGEVV was incorporated. This linker serves to connect the C-terminus of subunit I of PDGF BB to the N-terminus of subunit II. The construction of the designed sc-PDGF was executed using MODELLER, and the best structure was meticulously selected for further analyses (Figure 1D). This refined sc-PDGF structure incorporates strategic modifications and a linker sequence to enhance its functional properties, setting the stage for subsequent evaluations. Figure 1. PDGF BB binding sites determined by C Finder. Critical amino acid residues in the binding receptor in subunit I (A) and II (B) of native PDGF, 3D structure of native PDGF BB (C), and 3D structure of single-chain PDGF (D). The candidate binding sites to be modified, the substituted amino acid residues, and the linker are shown in red, green and yellow, respectively.
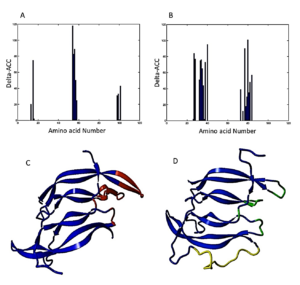
Figure 1. PDGF BB binding sites determined by C Finder. Critical amino acid residues in binding receptor in subunit I (A) and II (B) of native PDGF, 3D structure of native PDGF BB (C), and 3D structure of single-chain PDGF (D). The binding sites candidate to be modified, substituted amino acid residues, and the linker are shown in red, green and yellow, respectively.

Table 1. PDGF BB fragments are supposed to be modified, and fragments that replace them have similar geometry and secondary structure but different physicochemical properties.
  • Molecular Dynamics Simulations

The 3D structure of the designed single-chain PDGF (sc-PDGF) was modeled based on the crystal structure of wild-type PDGF BB. The structure with the lowest MODELLER objective function was selected for molecular dynamics (MD) simulations. The objectives of the MD simulations were to refine the sc-PDGF structures under similar conditions, compare them with native PDGF BB, and allow conformational relaxation before the docking study. After the simulations, the Root Mean Square Deviation (RMSD) and radius of gyration values for the backbone atoms of sc-PDGF were monitored relative to the starting structure during the MD production phase. The RMSD curves (Figure 2) indicated that the backbone atoms of the sc-PDGF structures were stable and reached equilibrium after 10 ns of simulation. Both structures exhibited RMSD values with no significant deviation. Additionally, the radius of gyration for the modeled sc-PDGF during the simulations showed negligible changes, indicating minimal alterations in the compactness of the proteins (Figure 2). These results affirm the stability and structural integrity of the modeled sc-PDGF during MD simulations, providing a solid foundation for subsequent analyses.
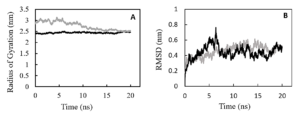
Figure 2. Molecular dynamic simulations result, RMSD and radius of gyration of the proteins during the simulations. RMSD (A) and radius of gyration (B) values of the backbone atoms of native PDGF BB (black) and sc-PDGF (gray) structures with respect to the reference coordinate during 20ns simulations.

  • Molecular Docking

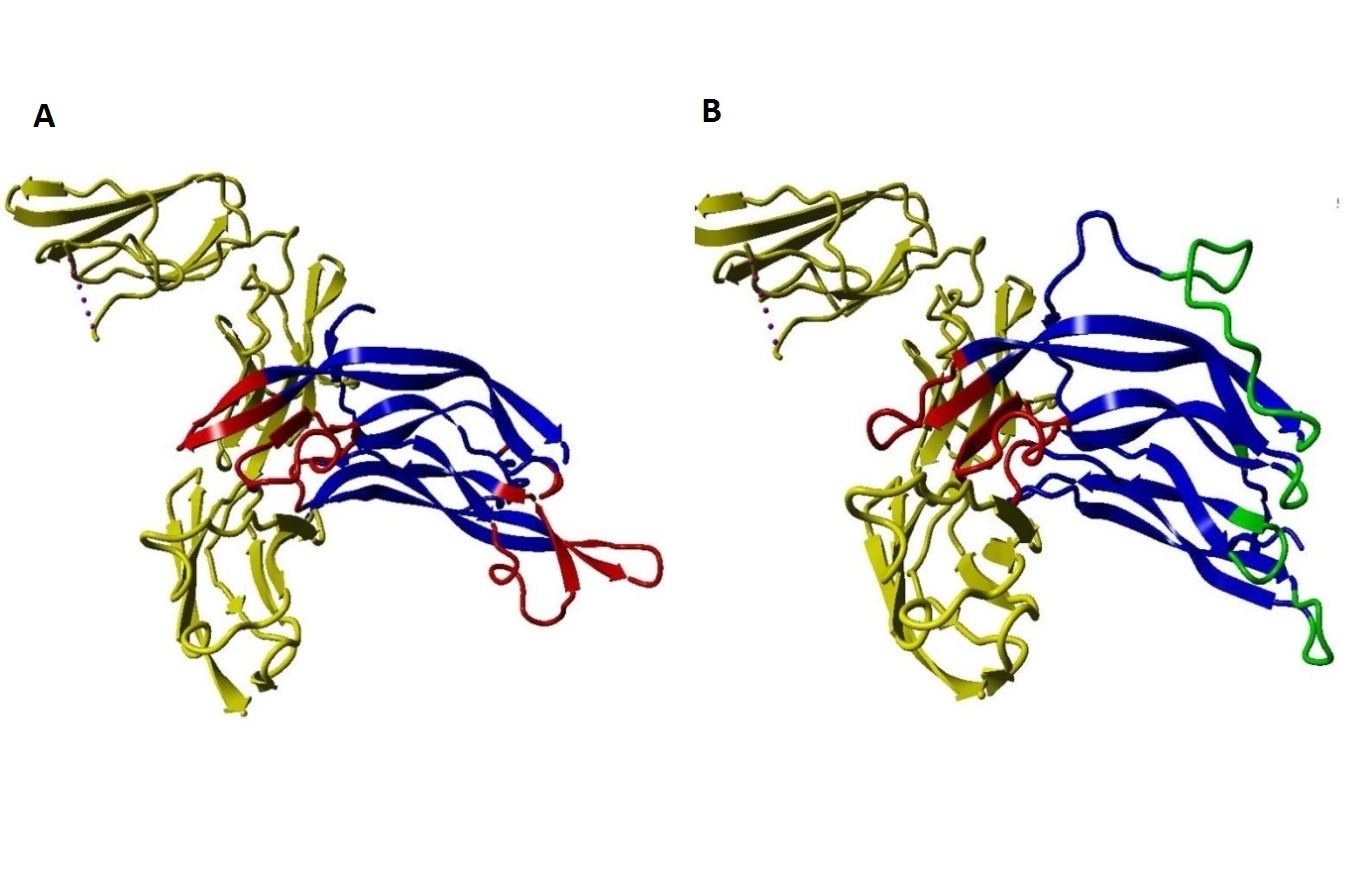
The binding ability of the modified PDGF to the receptors was predicted using ClusPro and compared with native PDGF. The docking results revealed distinctive features between native PDGF and the modified PDGF: Native PDGF demonstrated two high-score positions capable of binding to PDGF receptors (PDGFRs). These positions were located on two symmetrical binding sites at its two poles. The modified PDGF exhibited only one high-score position, aligning with the anticipated outcome. As expected, the modified interface of sc-PDGF lost its ability to bind the receptor, and the modified PDGF could only bind to PDGFR through one pole with a high score. Consequently, the dimerization of receptors cannot take place (Figure 3).

Table 2. Protein-Protein Interaction Prediction by ClusProThese results from ClusPro, as summarized in Table 2, confirm the differential binding scores and binding sites between native PDGF and the modified sc-PDGF. In Cluster 0, both native PDGF and modified PDGF show high scores for binding to one pole, with the intended binding site for sc-PDGF. In Cluster 1, native PDGF exhibits a high score for the symmetrical pole, while the modified PDGF shows a low score, indicating altered binding characteristics. The antagonistic sc-PDGF does not display any binding on the modified pole, supporting its role in preventing receptor dimerization.
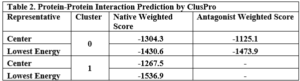
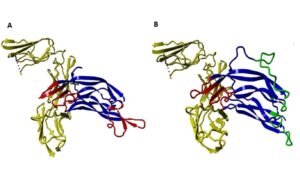
Figure 3. Protein-Protein Docking results ClusPro. The interaction between native PDGF BB and PDGFR. Native PDGF BB can bind with the receptor (yellow) by its own two equal poles shown in red (A), and the interaction between sc-PDGF and PDGFR, can only bind with the receptor by its unchanged pole (red sites). Substituted fragments cannot bind to the receptor, shown in green (B).

  • Construction of Active Antagonistic PDGF

The synthesis and expression of the modified PDGF-encoded gene were carried out in E. coli BL21 (DE3). Subsequent steps in the construction of active antagonistic PDGF involved the collection and washing of insoluble inclusion bodies with plate wash buffer. The inclusion bodies were then dissolved using a solution buffer, filtered through a 0.22 μm filter, and loaded onto a Ni-NTA agarose column. Purification and refolding processes were performed concurrently on the column, and finally, 0.5 ml eluted samples were collected.

The success of the purification process was confirmed through SDS-PAGE analysis, as depicted in Figure 4.
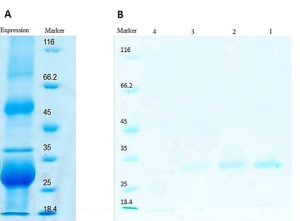
Figure 4. SDS-PAGE analysis of the expressed and purified sc-PDGF. Inclusion body in protein expression obtained from E. coli BL21 (DE3) (A) and SDS-PAGE results of refolding and purification on Ni-NTA affinity chromatography column. Lanes 1-4, eluted fractions collected from Ni-NTA affinity column (B).

  • Calculation of Secondary Structure Contents of sc-PDGF using CD Spectrum

The secondary structure contents of the single-chain PDGF (sc-PDGF) were calculated using the CD spectrum and compared to the predicted model and the crystal native structure. The results, as presented in Table 3, indicate slight differences between the calculated secondary structure contents of sc-PDGF and the predicted model and crystal native structure.

Table 3. Secondary structure contents of sc-PDGF obtained by CD compared to predicted from modeled sc-PDGF and crystal PDGF BB 3D structure.Anti-proliferation effect of Antagonistic PDGF
A cell viability test was conducted using A549 cells to assess the inhibitory effect of modified PDGF. The experiment involved incubating and treating 6000 A549 cells with different concentrations of the modified PDGF (Figure 5). The results indicate a dose-dependent inhibitory effect on cell proliferation; At a concentration of 0.25 μg/ml of PDGF antagonist, there was approximately a 30% inhibition of A549 cell proliferation compared to the control; a concentration of 0.75 μg/ml of PDGF antagonist resulted in approximately a 50% inhibition of cell growth; the highest concentration tested, 3 μg/ml of PDGF antagonist, resulted in a remarkable inhibition of cell proliferation, reaching up to about 90%. The concentration that inhibits 50% of cell proliferation (IC50) was calculated using Prism software and found to be 0.7151 μg/ml (27.7 nM).

Figure 5. Anti-proliferation Effect of Antagonistic PDGF on A549 Cells. Each concentration was performed with 3 replicates, error bar ≈ ± SD (standard deviation).

These results demonstrate the potent anti-proliferative activity of the modified PDGF antagonist on A549 lung cancer cells, indicating its potential as a therapeutic agent for inhibiting cancer cell growth.

DISCUSSION

The inhibition of the platelet-derived growth factor (PDGF) signaling pathway has been identified as a crucial target for the treatment of various malignant and nonmalignant diseases, including cancer and fibrotic diseases, where PDGF plays a pivotal role. The selective inhibition of the PDGF signaling pathway offers numerous advantages in the treatment of diverse diseases, minimizing potential side effects on other cells (16). In this study, we focused on designing and constructing a single-chain PDGF receptor antagonist, aiming to disrupt the dimerization of PDGF receptors and subsequently inhibit the PDGF signaling pathway. This approach is significant given the central role of PDGF in physiological and pathological conditions. The designed single-chain antagonistic PDGF (sc-PDGF) was constructed based on structural information derived from the PDGF BB/receptor complex. Molecular dynamics simulations and structural analyses were employed to evaluate the binding affinity and stability of the sc-PDGF mutant interface. The successful expression, purification, and refolding of sc-PDGF were confirmed through various techniques, including far-UV CD spectroscopy. The molecular docking results showed that sc-PDGF had a reduced ability to bind to PDGF receptors compared to native PDGF, supporting its potential as an effective antagonist. The calculated secondary structure contents of sc-PDGF, obtained through CD spectroscopy, indicated minimal changes, further affirming the structural integrity of the designed antagonist. Furthermore, the anti-proliferation assay demonstrated the potent inhibitory effect of sc-PDGF on A549 lung cancer cells in a dose-dependent manner. The calculated IC50 value highlighted the concentration at which 50% of cell proliferation was inhibited. This study provides valuable insights into the development of a targeted therapeutic approach for diseases associated with aberrant PDGF signaling. The designed sc-PDGF shows promise as a selective antagonist with potential applications in the treatment of cancer and fibrotic diseases, offering a novel avenue for the development of targeted therapies with minimized off-target effects. Future investigations may focus on in vivo studies and clinical applications to validate the therapeutic efficacy of the designed sc-PDGF. Current PDGF antagonists, particularly small molecule kinase inhibitors such as Imatinib, exhibit non-selectivity, leading to undesired side effects on various tissues (3, 29). Additionally, antibodies, while effective, come with high costs and may stimulate the immune system, posing potential challenges (29, 30). In our research, we aimed to develop a selective PDGF antagonist. The PDGF signaling pathway is initiated by the dimerization of PDGF receptors through dimeric PDGF. In our study, we focused on modifying one pole of the PDGF dimer, allowing the antagonistic PDGF to bind exclusively to one receptor. This modification prevents receptor dimerization, subsequently selectively inhibiting the PDGF signaling pathway. In a similar approach, Ghavami et al. successfully designed and synthesized a potent VEGF antagonist capable of inhibiting angiogenesis and preventing capillary tube formation in HUVEC cell lines (31). This strategy of selectively targeting specific pathways by modifying critical interaction sites has shown promise in controlling pathological processes. Our engineered sc-PDGF antagonist, designed to disrupt the dimerization of PDGF receptors, holds the potential for selective inhibition of the PDGF signaling pathway. This approach provides a novel alternative to existing PDGF antagonists, addressing issues related to non-selectivity and cost associated with current therapeutic options. Further studies, including in vivo investigations and clinical trials, will be crucial to validate the therapeutic efficacy and safety profile of the designed sc-PDGF. We identified the crucial amino acid residues responsible for binding to the receptor at one pole of PDGF BB within the shared interface of two subunits (Figure 1). Subsequently, we modified these residues to hinder binding, specifically -replacing Glu15 with Lys, introducing an opposite charge. We replaced the segment 54NNRN57 with ADED, which has opposite physicochemical properties while maintaining the same geometry. Additionally, the two crucial binding fragments, 25-43 and 74-85, in the other subunit were replaced with two turns. These turns were carefully selected from a database to ensure that they maintained the original geometry without amino acid residues that bind to the receptor (Table 1). The PDGF BB isoform was chosen due to its ability to bind and activate all PDGF receptor types (αα, ββ, and the heterodimer complex αβ). Furthermore, the crystal structure of the PDGF BB/PDGFR complex has been elucidated. We determined the sequence of the engineered sc-PDGF antagonist and modeled its 3D structure (Figure 1D). Molecular dynamics simulations were conducted on the modeled sc-PDGF to facilitate the conformational relaxation of its structure before the docking study. The RMSD and radius of gyration values indicated stable behavior with no significant deviation, as illustrated in Figure 2. Furthermore, the docking binding scores of both native and modified sc-PDGF to the receptor indicate a noteworthy difference. The native PDGF exhibits two high-scoring positions precisely on the expected sites, whereas the sc-PDGF shows only one high-scoring position (Table 2 and Figure 3). This suggests that the modified interface may have lost its ability to effectively bind to the receptor. The coding sequences of the sc-PDGF gene were synthesized and incorporated into pET28a expression vectors. Subsequently, E. coli BL21 (DE3) was transformed, and the modified sc-PDGF was expressed and refolded as outlined in the methods section. The presence of a linker between two PDGF monomers and a His tag at the N-terminus facilitated the purification and refolding process, streamlined by the Ni-NTA affinity chromatography column, as illustrated in Figure 4. The designed PDGF antagonist exhibited inhibitory effects on A549 cell proliferation, with a concentration of 3 µg/ml causing a notable reduction in cell growth to 10% compared to the control (Figure 5). This observation underscores the antagonist’s inhibitory impact on PDGFR, achieved through the prevention of receptor dimerization. Furthermore, the modified pole of sc-PDGF lost its ability to bind to the receptor, confirming the intended impact. According to the ClusPro docking results, sc-PDGF is predicted to have lost the ability to bind to two receptor molecules simultaneously. This loss is crucial in the context of PDGF dimerization and signaling, aligning with the findings from MTT assays. The results confirm the inhibitory effect of the antagonistic sc-PDGF on A549 cell lines, which is consistent with previous research. In a related study, demonstrated that inhibiting the PDGF receptor can effectively suppress cell growth in the A549 cell line (32). Our study’s notable advantage lies in the extracellular mechanism of inhibition, which has the potential to prevent cellular uptake. This approach addresses the challenges associated with cellular uptake, as well as intracellular metabolism and degradation of the drug (33, 34). Furthermore, the high selectivity of the designed antagonistic PDGF suggests a potential reduction in side effects on other cells. In a related study, Boesen et al. [reference] prepared single-chain variants of VEGF by incorporating a 14-residue linker between two monomers. Their findings demonstrated that these single-chain variants were fully functional and equivalent to the wild-type VEGF. In their work, Zhao et al. also successfully prepared an effective single-chain antagonist of VEGF (35). This was achieved by deleting and substituting critical binding site residues in one monomer of the native VEGF while keeping the other monomer intact. This strategic modification prevented the dimerization of the receptors, consequently inhibiting the VEGF signaling pathway (35). In parallel studies, Khafaga et al. and Qin et al. designed antagonistic VEGF variants by structurally analyzing VEGF and modifying amino acid residues at the binding site on one pole of the protein (36, 37). They successfully produced antagonistic single-chain VEGF and confirmed its inhibitory effect. Additionally, Kassem et al. demonstrated the antagonization of growth hormone (GH) by preventing receptor dimerization (38). This was achieved through the binding of one receptor molecule by monovalent fragments of GH, effectively preventing receptor dimerization and inhibiting the signaling pathway (39). Activation of PDGF receptors, similar to VEGF and growth hormone receptors, necessitates binding of ligands at two distinct sites to initiate receptor dimerization. Consequently, by deleting or modifying one binding site while preserving the other, the ligand occupies only one receptor, preventing the dimerization of receptors. This strategic modification inhibits the cascade phosphorylation of the receptor and its subsequent effects. In conclusion, PDGF signaling inhibitors have demonstrated efficacy in various clinical applications, particularly in certain cancers and fibrotic diseases. The engineered sc-PDGF antagonist, designed to bind to a single receptor, effectively prevents the dimerization of PDGFRs and inhibits their signaling pathway. Docking results highlighted the inability of the modified PDGF to bind on one pole while retaining binding on the other. The proliferation assay confirmed the inhibitory effects on A549 cells, suggesting that the sc-PDGF antagonist could serve as a potential therapeutic agent for diseases involving the PDGF signaling pathway.
Building Arabic Speech Recognition System Using HuBERT Model and Studying the Sources of Errors

Building a Framework for Visual Question Answering Systems

Prognostic Significance of Lactate Dehydrogenase (LDH) in COVID-19 Morbidity and Mortality

Cultivation of Flax (Linum Usitatissimum) Under The Conditions of The Syrian Coastal Region- Lattakia

Exploiting SUMO Fusion Technology for Enhanced Expression of Nanobodies Targeting Vascular Endothelial Growth Factor (VEGF) in Escherichia coli

INTRODUCTION

Angiogenesis, the branching out of new blood vessels from pre-existing vasculature, occurs physiologically during embryogenesis, the female reproductive cycle, and wound healing (1). It is also a crucial process in a variety of pathological conditions, including tumor growth, metastasis (2, 3), ischemic diseases, diabetic retinopathy (4, 5), chronic inflammatory reactions, age-related macular degeneration, rheumatoid arthritis, and psoriasis (6). Vascular endothelial growth factor (VEGF) is the most potent and predominant regulator of angiogenesis described to date (7, 8). This angiogenesis factor can instigate numerous biological responses in endothelial cells (ECs), such as survival, proliferation, migration, and vascular permeability, as well as the production of proteases and their receptors, creating prime conditions for angiogenesis (9, 10). It is estimated that up to 60% of human cancer cells express VEGF to create the vascular network necessary to support tumor growth and metastasis. Inhibiting angiogenesis has become an intensely investigated pharmaceutical area and represents a promising strategy for the treatment of cancer and several other diseases (11). Because of its central role in pathological angiogenesis, VEGF is a major therapeutic target. Strategies aiming to block the binding of VEGF to its receptors or to block intracellular signaling events form the basis of many new developments in anti-angiogenic cancer therapy (12). Numerous substances have been developed as angiogenesis inhibitors, some of which have already been approved for clinical use. These include monoclonal anti-VEGF antibodies (bevacizumab and ranibizumab) (13), anti-VEGF aptamers (pegaptanib), and VEGF receptor (VEGFR) tyrosine kinase inhibitors (sorafenib and sunitinib) (14, 15). Single-domain antibodies, also known as nanobodies or VHHs, possess valuable characteristics such as effective tissue penetration, high stability, ease of humanization, efficient expression in prokaryotic hosts, and high specificity and affinity for their respective antigens. Consequently, they can be introduced as alternative therapeutic candidates to traditional antibodies. VHHs represent the smallest functional unit of an antibody, preserving all of its functions, and due to their minimal size, they are also recognized as nanobodies (16, 17). Studies conducted by Shahngahian and colleagues in 2015 demonstrated that VEvhh10 (accession code LC010469) has a potent inhibitory effect on the binding of VEGF to its receptor (18). This VHH exerts its inhibitory role by binding to the VEGF receptor binding site. Among the members of the VHH phage display library, VEvhh10 possesses the highest binding energy at the VEGF receptor binding site, covering vital amino acids involved in the biological activity of VEGF and disrupting its function (18). The conventional expression of nanobodies in E.coli faces several challenges, primarily stemming from their small size and complex folding requirements. Nanobodies often exhibit low solubility, leading to the formation of inclusion bodies and hampering their functional utility. Moreover, the intricate disulfide bond formation and protein folding pathways of nanobodies make them prone to misfolding and aggregation within the bacterial cytoplasm (19-21). One standard method for expressing non-fused VHH is the use of E. coli expression systems. However, expressing non-fused VHH using conventional cytoplasmic expression methods in this prokaryotic system often faces challenges, including low expression, poor solubility, and misfolding of the antibody in E. coli (22-24). To overcome these shortcomings, we chose a novel expression system using a small ubiquitin-related modifier (SUMO) molecular partner (25, 26). SUMO Fusion Technology has emerged as a powerful tool for enhancing the soluble expression of proteins, including nanobodies, in E. coli. By fusing the target protein with the SUMO protein, researchers can promote proper folding, enhance solubility, and increase expression yields. SUMO fusion tags facilitate protein purification and can be cleaved post-purification to yield the desired protein product in its native form (27). SUMO is covalently attached to other proteins and plays roles in post-translational modifications (28). These roles include significantly increasing the yield of recombinant proteins, facilitating the correct folding of the target protein, and promoting protein solubility (29). The aim of this study was to develop an alternative method for more efficient production of VHH nanobodies in an E. coli-based expression system using the SUMO fusion tag. The SUMO fusion tag improves the solubility and yield of VHHs. Our results demonstrated that SUMO is very effective in promoting the soluble expression of VHH in E. coli. The resulting recombinant bioactive VHH can be used for therapeutic applications and clinical diagnosis in the future.

MATERIALS AND METHODS

Molecular and Chemical Materials

The materials, chemicals, and reagents required for the lab are listed as follows:

Ampicillin, kanamycin, and agarose from Acros (Taiwan), IPTG from SinaClon (Iran)

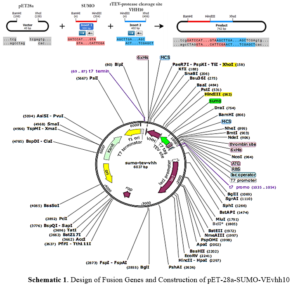
Ni-NTA resin from Qiagen (Netherlands), Plasmid extraction kit and gel extraction kit from GeneAll (South Korea), Enzyme purification kit from Yektatajhiz (Iran), Restriction enzymes HindIII/XhoI, ligase enzyme, and other molecular enzymes from Fermentas (USA), Pfu polymerase and Taq polymerase from Vivantis (South Korea), Primers from Sinagen (Iran), Methylthiazole-tetrazolium (MTT) powder from Sigma (USA), Penicillin-Streptomycin, Trypsin-EDTA, and DMEM-low glucose from Bio-Idea (Iran), Fetal Bovine Serum (FBS) from GibcoBRL (USA), Monoclonal conjugated anti-human antibody with HRP from Pishgaman Teb (Iran), Anti-Austen antibody from Roche (Switzerland), Other chemicals from Merck (Germany). Schematic 1 shows a schematic diagram of the construction of the pET-28a-SUMO-TEV-VEvhh10 Gene using SnapGene v5.1.5.

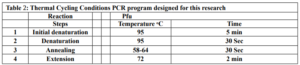
First, suitable primers were designed by OligoAnalyzer to isolate the SUMO gene sequence (see Table 1). The plasmid was used as a template for the polymerase chain reaction (PCR). Amplification was performed using the Pfu polymerase enzyme in a thermal cycler, utilizing the software we designed for this research (see Table 2). Different temperatures were tested (58, 59.5, 61, 62.5, 64) for primer annealing to the PCR template, with 58 °C being selected as the optimum temperature. The restriction enzyme sites were incorporated at the beginning and end of the primers. Additionally, the TEV protease cleavage site was placed between the SUMO and VEvhh10 sequences.

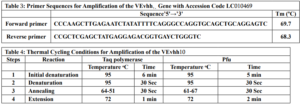
Gene Cloning: Primers for the amplification of the VEvhh10 gene with the accession code LC010469 were initially designed (Table 3). The plasmid containing the gene fragment served as a template for the PCR reaction. Amplification was carried out using Taq polymerase and Pfu polymerase enzymes in a thermocycler with a programmed temperature profile (Table 4). Various annealing temperatures for primer binding to the template were tested, and a temperature of 65°C was found to be the optimal annealing temperature. Primer cutting sites at the beginning and end of the Gene were designed, and the location of the TEV protease enzyme cutting site was positioned between the SUMO and the VEvhh10 sequence.


The gene fragments of SUMO and VEvhh10, amplified using Pfu polymerase via PCR, were extracted from the gel. Simultaneously, the amplified fragments and the pET-28a vector were digested using the BamHI and XhoI restriction enzymes. Purification was carried out using a commercial enzyme purification by GeneAll kit. Subsequently, the gene fragments were ligated into the target vector using T4 DNA ligase enzyme. The resulting ligated product was incubated overnight at 4°C. The ligated product was then transformed into E. coli DH-5α bacteria. To confirm the insertion of the Gene into the vector, the transformed bacteria were plated on kanamycin antibiotic-containing LB agar plates. Finally, the obtained colonies underwent Colony PCR using specific primers targeting VHH, T7 promoter, and terminator regions. The PCR products were analyzed on a 1% agarose gel, and positive transformants were screened and cultured further. The non-recombinant plasmid was purified using a plasmid extraction kit, and enzymatic digestion was performed to confirm the insertion of the gene fragment into the plasmid.

 Expression and Soluble Detection of Recombinant SUMO-VHH

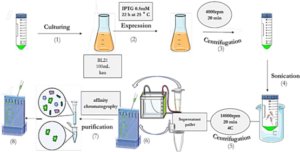
As depicted in Schematic 2, the pET-28a plasmid containing SUMO and VHH was transformed into E.coli BL21 (DE3) expression host cells using the heat shock method. The accuracy of transduction was confirmed by isolating colonies grown on LB agar medium supplemented with 50 mg/mL kanamycin. To express the genotype protein, a colony of bacteria containing the recombinant expression plasmid was inoculated into 10 mL of LB culture medium supplemented with 50 mg/mL kanamycin antibiotic and incubated at 37°C with optimal aeration at 250 rpm. Subsequently, 1 mL of mature bacteria was transferred to 50 mL of LB medium containing kanamycin antibiotics and incubated at 37°C until the OD600 reached approximately 0.6. Expression was induced by adding 0.5 mM IPTG and continued for 22 hours at 25°C. Following expression, the resulting product was centrifuged at 4000 rpm for 15 minutes at 4°C, and the bacterial cells were sonicated in lysis buffer (pH 8). The sonication product was centrifuged again at 12,000 rpm for 20 minutes at 4°C, and the supernatant was analyzed using the SDS-PAGE method (30). Proteins were purified by gradient chromatography using a nickel agarose column. The protein sample was transferred to the column pre-equilibrated with wash buffer (50 mM Tris-base, pH 8.0, 300 mM NaCl, 20 mM imidazole). Proteins that did not bind to the column due to the lack of histidine sequence were removed. Only the target protein remained attached to the column due to the presence of the histidine sequence. The bound proteins were eluted using elution buffer (50 mM Tris-base, pH 8.0, 300 mM NaCl, 250 mM imidazole). Purification was conducted using cold buffers to prevent thermal degradation of the proteins. Protein concentration was determined using the Bradford method with BSA as the protein standard (31).

Schematic 2: Expression and Purification of SUMO-VHH
                Schematic 2: Expression and Purification of SUMO-VHH

The expression and purification of VEGF8-109

The His-tagged VEGF8-109-RBD was expressed in E.coli BL21 (DE3) bacterial cells and subsequently purified using a Ni-NTA agarose column, following previously described protocols with slight modifications (32). Protein expression and purification were analyzed through sodium dodecyl sulfate-polyacrylamide gel electrophoresis (SDS-PAGE) and Coomassie Brilliant Blue R250 staining. To remove excess salt, the purified protein was dialyzed three times against phosphate-buffered saline (PBS) containing 10% (v/v) glycerol at 4 °C for 12 h. Protein concentration was estimated using the Bradford assay, with BSA as a standard (31).

ELISA-Based Immunoassay

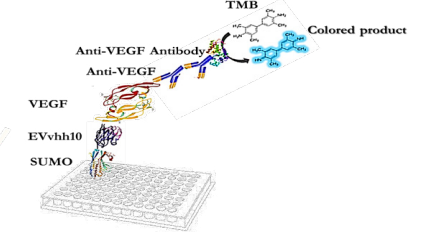
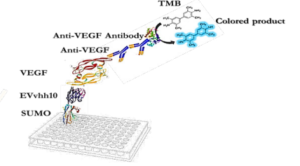
The designed immunoassay is shown in Schematic 3. First, 100 μL of SUMO-VHH recombinant protein in carbonate-bicarbonate buffer was added to each well of a cell ELISA and incubated for 16 hours at room temperature. After 16 hours, the supernatant solution was dried and washed three times with 100 μL of PBS buffer. The blocking step was performed using a PBS solution containing 2% gelatin in a volume of 350 μL and placed at 37°C for 1 hour. Subsequently, the blocking buffer was dried and washed three times with 100 μL of PBST buffer (PBS + 0.05% Tween-20). Next, 100 μL of serially diluted VEGF solutions (ranging from 0.5 ng/mL to 1000 ng/mL) were added to the wells and incubated for 2 hours at room temperature. After incubation, all wells were dried and thoroughly washed three times with PBST buffer. Following this, 100 μL of human anti-VEGF monoclonal antibody at a concentration of 1000 ng/mL was added to the wells. After washing with PBST, 100 μL of HRP-conjugated anti-human IgG antibody was added to each well and incubated in the dark at 37°C for 1.5 hours. Subsequently, 100 μL of TMB was added to each well and incubated for 15 minutes in the dark. Finally, 100 μL of 2 N sulfuric acid was added to each well, and the absorbance of the wells was read at a wavelength of 450 nm (33).

Schematic 3: Design of ELISA-Based Immunoassay to Measure VEGF Concentration Using Recombinant SUMO VHH

RESULTS

Products of the PCR Reaction

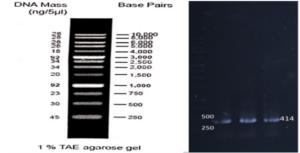
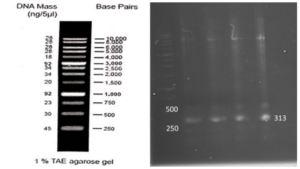
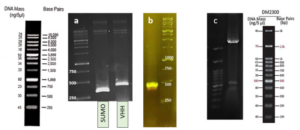
Based on our previous study (34), the VEvhh10 gene was amplified using pfu polymerase at an annealing temperature of 65 °C as showed in (Fig. 1).

Fig. 1: VEvhh10 gene was amplified using pfu polymerase at an annealing temperature of 65°C.
     Fig. 1: VEvhh10 gene was amplified using pfu polymerase at an annealing temperature of 65°C.
Fig .2: Products from the Gradient Polymerase Chain Reaction with the Pfu Polymerase Enzyme. Wells from left to right, with annealing temperatures ranging from 58°C to 64°C.

Construction of pET28a-SUMO-VHH Expression Plasmid

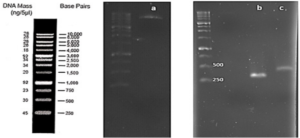
As depicted in (Fig. 3), the VEvhh10 product (402 bp) was amplified and double digested using HindIII and XhoI enzymes. The resulting product underwent purification in the preceding steps. The SUMO product, generated by the Pfu enzyme, was double digested using HindIII and BamHI enzymes, and the product (304 bp) was purified. Additionally, the plasmid pET28a was double digested using BamHI and XhoI enzymes, and the resulting product was also purified in preparation for the conjugation process.

Fig. 3: a) Plasmid pET28a after double digestion using the cutting enzymes BamHI and XhoI. Purification of the product. b) Products of the PCR reaction SUMO with the enzyme pfu after double digestion using the cutting enzymes HindIII and BamHI and purifying the product. c) Products of the PCR reaction VEvhh10 with the enzyme pfu after double digestion using the cutting enzymes HindIII and XhoI and purifying the product.

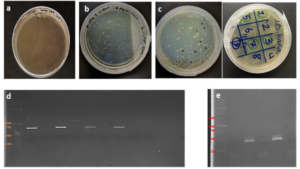
After joining the aforementioned sequences with the presence of the T4 DNA ligase enzyme, the respective products were incubated at 4°C for 14 hours and transformed into E. coli DH5α. The transformed product was cultured on a kanamycin plate, as shown in (Fig. 4.b). Agar plates containing the antibiotic ampicillin were labeled as a negative control, as depicted in (Fig. 4.a). Subsequently, in (Fig 4. c), some samples were isolated and confirmed using colony PCR by specific primers related to the T7 Promoter and Terminator, as shown in (Fig 4.d), and specific primers related to VHH, as depicted in (Fig. 4.e).

Fig 4: a,b,c ) Transformation steps in E.coli (DH5 α). d) Colony PCR by specific primers related to T7 Promoter and Terminator. e) Colony PCR by Forward and Reverse VHH primers.

Confirmation of Gene Cloning

A fresh single colony was grown in LB agar containing the antibiotic kanamycin, and the extracted plasmid was used as a template to amplify the target gene and construct the SUMO-VHH. This step aimed to confirm the correctness of the gene cloning stage. PCR was carried out using the Forward and Reverse primers of the VEvhh10 gene (414 bp) and SUMO gene (approximately 310 bp), as depicted in (Fig. 5.a), as well as the Forward T7 promoter Reverse SUMO primers (approximately 470 bp), as shown in (Fig. 5.b). To ensure further reassurance, the plasmid was double digested using the cutting enzymes BamHI and XhoI. The double enzymatic digestion process was performed, and the desired Gene was observed on the gel, as illustrated in (Fig. 5.c). The results indicated the success and confirmation of gene cloning.

Fig.5: a) PCR product with Forward and Reverse primers of the SUMO gene (approximately 300 bp) and the VEvhh10 gene (414 bp). b) PCR product with Forward T7 promoter and Reverse SUMO primer (approximately 470 bp). c) The plasmid was double digested using the cutting enzymes BamHI and XhoI.

Expression and Purification of the SUMO_VHH

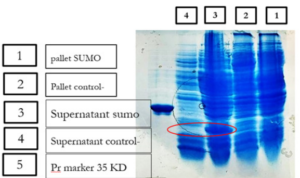
E.coli cells harboring SUMO-VHH were induced by 0.5 mM IPTG for 22 h at 25°C. The cell pellets were harvested by centrifugation, and protein was extracted and separated by sonication and centrifugation. The supernatants and precipitate were collected and subjected to 12% SDS-PAGE analysis. As depicted in (Fig. 6), the expression of a 24 kDa protein, similar to the predicted size, was induced by IPTG, compared with the negative control (blank plasmid) or recombinant bacteria without IPTG induction.

Fig.6: Confirmation of cytoplasmic expression of SUMO-VEvhh10 with the help of sodium dodecyl sulfate-polyacrylamide gel electrophoresis. The samples examined include, from right to left, 1 - sedimentation of transforming bacteria and induced with IPTG after their lysis, 2 - Transformed, untransformed and post-lysis bacterial sediments, 3 - Transformed and induced bacterial supernatants after lysis, 4 - Untransformed and induced bacterial supernatants after lysis, 5 - 35 kDa molecular weight protein as a protein marker.
Fig.6: Confirmation of cytoplasmic expression of SUMO-VEvhh10 with the help of sodium dodecyl sulfate-polyacrylamide gel electrophoresis. The samples examined include, from right to left, 1 – sedimentation of transforming bacteria and induced with IPTG after their lysis, 2 – Transformed, untransformed and post-lysis bacterial sediments, 3 – Transformed and induced bacterial supernatants after lysis, 4 – Untransformed and induced bacterial supernatants after lysis, 5 – 35 kDa molecular weight protein as a protein marker.

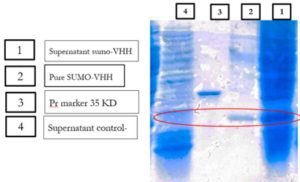
Previous studies have indicated that recombinant antibodies often form inclusion bodies using traditional E. coli expression methods (35). Our results suggest that SUMO is very helpful in promoting the soluble expression of VHH (36). To obtain high-purity recombinant protein, Ni-NTA chromatography was employed for purification because the 6His-tag was located in the N-terminal of SUMO. Different concentrations of imidazole were tested to elute the recombinant protein. The results showed that SUMO-VHH was efficiently eluted from the Ni-NTA column using an elution buffer containing 250 mM imidazole. SDS-PAGE analysis demonstrated that the purity of SUMO-VHH exceeded 90%, as shown in (Fig. 7).

Fig.7: Purification with a nickel agarose affinity.
                    Fig.7: Purification with a nickel agarose affinity.

Expression and Purification of Recombinant VEGF 8-109

As indicated by our previous research, recombinant VEGFRBD8-109 was produced in soluble form in E. coli BL21 (DE3) strain after induction for 22 hours at 24°C. Purification of the His-tagged fusion protein was performed using Ni-NTA affinity chromatography. The activity of the unconjugated VEGF RBD 8-109 produced was also evaluated through its effect on the growth and proliferation of human umbilical vein endothelial cells (HUVECs) using the MTT assay (37, 38). Cell proliferation was good with an increase in the concentration of unfused VEGF RBD 8-109. At a concentration of 240 ng/ml, the cell count reached approximately 80% compared to the sample lacking VEGF8-109 (34). Accordingly, it can be used in VHH-SUMO binding assays.

Investigating the Binding Ability of Recombinant SUMO-VEvhh10 with VEGF RBD 8-109

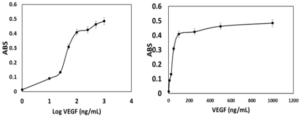
To verify the binding ability of recombinant SUMO-VEvhh10 to VEGF, an ELISA-based immunoassay was utilized according to the method described earlier. The results of the dose-response curve of VEvhh10-SUMO expressed using the ELISA method (Fig. 8) demonstrated that as the VEGF concentration increased, more anti-VEGF molecules were attached, resulting in increased light absorption.

Fig. 8: Dose-response curve of recombinant SUMO VEvhh10 protein ELISA to detect VEGF.

DISCUSSION

The success of this study in amplifying, cloning, and expressing the VEvhh10 and SUMO genes underscores the utility of pfu polymerase and enzyme-based digestion for accurate gene construction as depicted in (Fig. 1), (Fig. 2), (Fig. 3) and (Fig. 5). The transformation of the ligated products into E. coli DH5α and subsequent colony PCR verification demonstrate that this method is efficient for cloning single-domain antibodies like VHH. The ability to amplify and clone the VEvhh10 gene with precision using pfu polymerase is consistent with earlier reports, which highlight the enzyme’s high fidelity in DNA replication and amplification compared to Taq polymerase. This methodological choice was critical in ensuring the accuracy of the VEvhh10 sequence during amplification (34). Moreover, the fusion of SUMO to VHH played a crucial role in enhancing the soluble expression of VHH. Previous studies have shown that recombinant VHHs often suffer from poor solubility and tend to aggregate into inclusion bodies when expressed in E. coli (35). The presence of SUMO, a small ubiquitin-like modifier, aids in overcoming this limitation by acting as a solubility-enhancing partner. SUMO fusions not only improve the solubility of the target nanobodies but also stabilize it during expression in bacterial hosts (36). In this study, SUMO fusion resulted in high yields of soluble VHH, which was efficiently expressed and purified using Ni-NTA chromatography with purity exceeding 90% as depicted in (Fig. 6) and (Fig. 7). This high purity, confirmed by SDS-PAGE, highlights the effectiveness of SUMO in both solubility enhancement and streamlined purification using His-tag. The successful production of recombinant VEGF 8-109 and its biological activity in promoting HUVEC proliferation further supports its use in functional assays. The MTT assay results, showing increased cell proliferation in response to VEGF 8-109, are consistent with previous research that indicates the importance of VEGF in promoting angiogenesis and endothelial cell growth (34). This validates the functional integrity of the expressed VEGF 8-109, suggesting that it retains its biological activity post-purification. The recombinant VEGF 8-109 can now serve as a valuable reagent in future binding assays with VHH or other therapeutic antibodies targeting VEGF pathways. Furthermore, the ELISA-based binding assays confirmed that SUMO-VEvhh10 binds effectively to VEGF, with increasing concentrations of VEGF resulting in a corresponding increase in light absorption as depicted in (Fig. 8). This binding affinity is crucial, especially for applications where VHH antibodies might be used to inhibit VEGF-mediated signaling, which is implicated in pathological conditions such as cancer and age-related macular degeneration (39). The observed binding behavior is consistent with previous works where VHH antibodies, despite their small size, exhibit strong binding capabilities to their respective antigens. This reinforces the potential of SUMO-VEvhh10 as a therapeutic agent targeting VEGF-related diseases, and the use of the SUMO fusion strategy could offer advantages over traditional expression systems by improving stability, solubility, and yield. Comparatively, the SUMO fusion system has demonstrated its superiority over other solubility-enhancing tags such as GST or MBP in maintaining the bioactivity of recombinant proteins (40, 41). While GST and MBP are effective in promoting solubility, they can sometimes mask epitopes or interfere with downstream applications, making SUMO a preferable option in cases where antigen binding and bioactivity must be preserved (42).  This study adds to the growing body of literature that underscores the effectiveness of SUMO fusion in producing functional and soluble VHH antibodies for therapeutic applications. Future work could focus on optimizing expression conditions to further enhance yield or test the efficacy of SUMO-VEvhh10 in animal models of VEGF-related diseases.

CONCLUSION

This study highlights the utility of SUMO Fusion Technology for enhancing the expression of VEvhh10 targeting VEGF in E. coli. The successful production of soluble VHH against VEGF underscores its potential for future therapeutic and diagnostic applications in various diseases.

Machine Learning Techniques In Wdm-Fso Systems: Comparative Study

A Method To Prepare An Economic Substitute For Agarose Gel Along With A Low-Cost Electrolyte For Functional DNA Gel Electrophoresis

INTRODUCTION

Electrophoresis is a method for separating charged particles under an electric field. Electrophoresis, in its various forms or types, has become the most widely used method for analyzing biological molecules in biochemistry or molecular biology, including genetic components such as DNA or RNA, proteins, and Polysaccharides [1] [2]. The high-precision of electrophoresis has made it an important tool for advancing biotechnology [3]. Agarose gel electrophoresis is a form of electrophoresis used to separate DNA fragments based on their size [4]. Under the influence of an electric field, fragments will migrate to either the cathode or the anode, depending on the nature of their net charge. It is the most common means of separating moderate to large-sized nucleic acids and has a wide range of separations [5]. And an effective method for separating, identifying, and purifying 0.5 to 25 kb DNA fragments. It is known that the mobility is independent of the size of DNA with the size ~400 base pairs (bp) and larger, and it varies with the ionic strength of the electrolyte solution used [6]. The development of gel electrophoresis as a method for separating and analyzing DNA has been a driving force in the revolution of molecular biology over the past 20 years [7]. These techniques are now used by thousands of researchers and laboratory workers. More than half of all scientific papers published in biochemistry currently rely on electrophoresis methods [8]. In principle, understanding DNA gels conceptually is easy and technically feasible. In practice, many small details affect the accuracy and repeatability of the results [7]. The electrophoresis of Agarose gel is typically carried out using either Tris acetate EDTA (TAE) or Tris boric acid EDTA (TBE) buffers [9]. Research has identified other effective solutions compared to the mentioned buffers, with sodium bicarbonate being one of the most important due to its wider availability and much lower cost than other buffers [10]. Many researchers have studied alternatives to gel agarose that are less costly, these studies have included: gelatin, agar, and corn starch [11] [12] [13].The use and study of plant-based gel has not been sufficiently explored in previous research, so we focused on this type of gel in our study as it can be more easily and readily sourced than agar gel and is relatively cheaper. It can be concluded that the effective use of plant-based gel may lead to a wider range of electrophoresis application.

MATERIALS AND METHODS

Preparation of 1 L of 1X TAE buffer from 40X stock In DNA-related biological experiments, buffers are used to maintain a constant physiological pH. The electrophoretic mobility of DNA has been found to be strongly buffer dependent with TAE buffer pH for DNA fragments being ]15[ ]14[ 8.0. A volume of 50 mL of 40X TAE (Promega®) was measured into a 2 L beaker and was topped up with 1950 mL of distilled water to obtain a working solution of 1X TAE. Preparation of agarose gel (positive control) Agarose, a strongly gelling polysaccharide, is a common ingredient used to optimize the viscoelastic properties of a multitude of food products. This polymer is composed of a repeating disaccharide unit called agarobiose, which consists of galactose and 3,6-anhydrogalactose [16] [17]. The concentration of agarose in a gel depends on the size of the DNA fragments, which are separated with most gels ranging from %0.5 to ]19[ ]18[ %2. 1 g of electrophoresis-grade agarose (Vinantis®) was added to 100 ml of electrophoresis buffer. The gel was then prepared by melting the agarose in a microwave oven or autoclave and swirling to ensure even mixing. Melted agarose should be cooled to 50-60°C under running tap water before pouring it onto the gel cast. Gels are typically poured between 0.5 and 1 cm thick. The volume of the sample wells is determined by both the thickness of the gel and the size of the gel well [20]. Preparation of corn starch gel To prepare boric acid and sodium hydroxide buffers, corn starch was modified by adding amount of 1.855 g of boric acid and 0.48 g of NaOH, which were added to a 1 L beaker containing 200 ml of distilled water and stirred to homogeneity. We added 36 g of corn starch to the mixture and topped up with distilled water to the 1 L mark. The solution was stirred very well and allowed to stand in a water bath at 50 °C for 30 min. the supernatant was discarded, and the precipitant was kept. Next, 30 ml of distilled water was added to the precipitant and stirred to homogeneity, and then the Beecher was set in a water bath until it was dried. The modified dry starch was then ground until it became powder. An amount of 12 g of the modified corn starch was weighed and added to a beaker containing 100 ml of 1X TAE and the beaker was placed in a water bath until boiling. The supernatant was discarded, and the precipitant was taken and poured into the gel cast with the combs in place, and left until it solidified [13]. Preparation of Animal gelatin gel An amount of 1 g of animal gelatin powder was weighed and added to a beaker containing 100 ml of 1X TAE buffer. It was mixed well and microwaved for 2 minutes, with stopping every 30 s to gently mix it. The solution was cooled underwater. The gel was then poured into the gel cast. This protocol is commonly used in research. Preparation of an agar–animal gelatin gel mixture An amount of Agar (0.5 g) and animal gelatin (0.5 g) were weighed and added to a beaker containing 100 ml of 1X TAE buffer. The remaining steps are as mentioned in the animal gelatin gel. Preparation of %1 Agar gel An amount of 1 g of Agar was weighed and added to a beaker containing 100 ml of 1X TAE buffer. The remaining steps are identical to those for animal gelatin gel. Preparation of 1 L of sodium bicarbonate (SB) buffer Sodium borate is a Tris-free buffer with low conductivity. Therefore, gels can be run at higher voltages. SB produces sharp bands and nucleic acids can be purified for all downstream applications. However, SB is not as efficient as Tris-based buffers for resolution bands larger than 5 kb. Under standard electrophoretic conditions, SB provided resolution and separation as good as or better than TBE and TAE gels [21] [22]. A volume of 2 g of sodium bicarbonate, 0.12 g of NaOH and 0.05 g of NaCl was poured into a 1 L beaker and was topped up with 1 L of water to obtain a working solution of SB buffer [10]. Preparation of 1.5 % food grade agar-agar gelatin gel An amount of 3.75 g of food grade agar-agar gelatin powder was weighed and added to a beaker containing 250 mL of SB buffer. It was mixed well and microwaved for 2 minutes, with stopping every 30 seconds to gently mix it to avoid bubbles. The solution was cooled underwater. The gel was then poured into the gel cast. A 15 well comb was inserted, and the gel was left to solidify. The comb was gently removed, and the gel was placed in a horizontal gel tank. Sodium bicarbonate buffer was added to the gel tank at the maximum mark. Loading samples into modified corn starch %1 gel and agar – animal gelatin mixture %1 gel Loading ten microliters (10 µl) of human genomic samples [23] [24] after mixing them with 3 microliters (3 µl) of loading dye for all wells. The gel was placed in the tank containing 1X TAE buffer, passed through an electric current of 60 V for 5 minutes and then increased to 95 V for 1 hour. Afterward the gel was removed from the horizontal gel tank and dyed in Ethidium Bromide for 30 minutes because ethidium bromide (EtBr) is sometimes added to the running buffer during the separation of DNA fragments by agarose gel electrophoresis. It is used because when the molecule is bound to the DNA and exposed to a UV light source [25], Ethidium binds strongly to both DNA and RNA at sites that appear to be saturated when one drug molecule is bound for every 4 or 5 nucleotides [26]. It is then transferred to a tank of water with mild shaking for washing for 2 minutes. The gel was removed and viewed using a gel documentation device (UVP BioDoc-It). Loading Samples and Electrophoresis The DNA molecular weight standard control, also called the DNA marker (Ladder), the DNA ladder was separated by conventional agarose gel electrophoresis [27] [28]. Loading 10µL of human genomic samples after mixing them with 3µL of loading dye for wells 3 ,2 ,1 and 4, and 3µL of 50 bp DNA Ladder (vivantis®) in the fifth well. The electrophoresis involved the following steps: First, the voltage was 30 V for 5 minutes, the volt was increased to 45 V for 5 minutes, then to 60 V for 5 minutes, then to 70 V for 10 minutes, then to 90 V for 1 hour and a half (1.5 h). At the end, the voltage was increased to 95 V for 45 minutes in order to avoid DNA escaping from the wells. The gel was removed from the horizontal gel tank and dyed in Ethidium Bromide for 30 minutes and then transferred to a tank filled with washing water for 2 minutes. The gel was removed and viewed using a gel documentation device (UVP BioDoc-It). This protocol was performed for the %1 agarose gel and %1.5 treated food grade agar-agar gel.

RESULTS

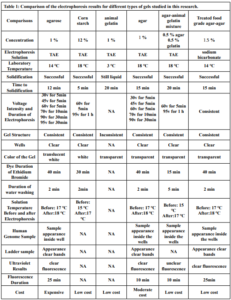
Electrophoresis was performed for human genome samples, and a ladder of agarose gel with TAE solution was used as a control for the studied samples: Corn starch gel with TAE solution, agarose gel with TAE solution, animal gelatin with TAE solution, agar with TAE solution, agar – animal gelatin mixture with TAE solution, and food grade agar-agar gelatin with a solution of sodium bicarbonate sodium hydroxide and sodium chloride. All experiments were carried out under similar conditions of pH and using the same equipment and tools. Many aspects were compared during the experiment on a repetitive level, and a mean of duration of solidification, texture, color, dye duration and other parameters are mentioned in Table1.

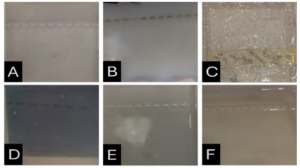
From Figure 1 we find that the animal gelatin gel (c) forms a surface ice layer and is not fully hardened. One of the reasons for this is the very low heat and low concentration of animal gelatin. Corn starch gel (B) gave a white color and similar properties in terms of the structure with agarose gel. Other gels gave properties in structure and color very similar to agarose gel.

Fig. 1. (A) Agarose 1% gel treated with TAE buffer, (B) 12 % Corn starch gel treated with TAE buffer, (C) 1% Animal gelatin gel treated with TAE buffer, (D) 1 % agar - animal gelatin mixture treated with TAE buffer, (E) 1 % Agar gel treated with TAE buffer, (F) 1.5 % Gel made from treated food grade agar-agar gel with sodium carbonate, sodium hydroxide, sodium chloride.
Fig. 1. (A) Agarose 1% gel treated with TAE buffer, (B) 12 % Corn starch gel treated with TAE buffer, (C) 1% Animal gelatin gel treated with TAE buffer, (D) 1 % agar – animal gelatin mixture treated with TAE buffer, (E) 1 % Agar gel treated with TAE buffer, (F) 1.5 % Gel made from treated food grade agar-agar gel with sodium carbonate, sodium hydroxide, sodium chloride.

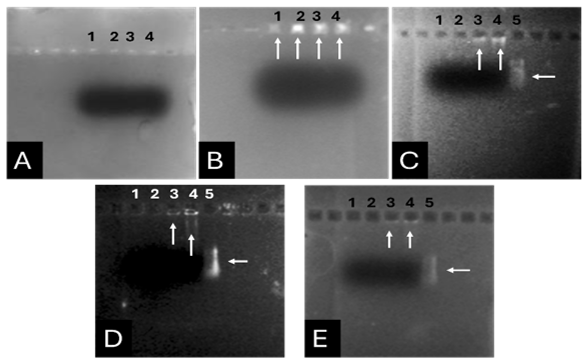
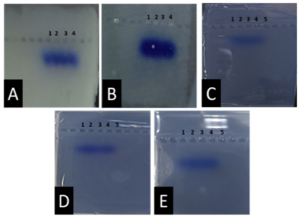
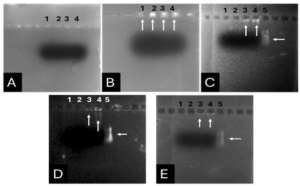
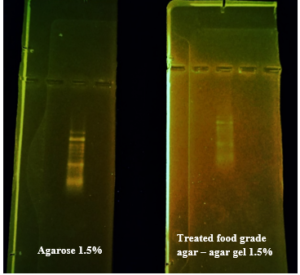
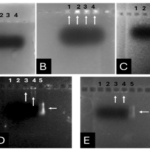
Before the samples were exposed to UV radiation, we can see from Figure 2 that the loading dye was electrophoresed for a distance of 1.2 cm in corn starch gel (A), for a distance of 1.7 cm in agar – gelatin mixture gel (B), for a distance of 0.9 cm for the loading dye and 1.3 cm for the Ladder in agar gel (C), for a distance of 1.4 cm for the loading dye and 1.7 cm for the Ladder in agarose gel (D), for a distance of 1.2 cm for the dye and 1.7 cm for the Ladder in treated food grade agar – agar gel (E) at the voltage and time shown in Table 1 for each gel mentioned. After the electrophoresis of 12% modified corn starch gel, 1% agar – animal gelatin mixture gel, 1% agar gel, 1% agarose gel, and 1.5 % of our treated food grade agar-agar gel with BS buffer, a separation of DNA was apparent, as shown in Figure 3, the modified Gel that is annotated with (E) in the Figure 3 shows good separation of the 50 bp DNA ladder (Vivantis®) in the 5th well, and the 4th well in E is genomic DNA extracted from human saliva. As for agarose gel D in Figure 3, good separation occurred in the 5th well and it showed resemblance to agarose gel in C. The gels were exposed to ultraviolet radiation and examined; we noticed that the disappearance of the fluorescence from the treated food grade agar-agar gel after 15 minutes, while the agarose retained its fluorescence for 25 minutes before the bands vanished from the UV. Knowing that the gels were dyed with the same type and concentration of dye and duration of time. For an electrophoresis buffer consisting of sodium bicarbonate, sodium hydroxide, and sodium chloride, it has shown high efficiency in securing the ions needed for electrophoresis while maintaining its physical and chemical properties; thus, it can be considered an equivalent solution to TAE solution. These results demonstrate the effectiveness of this variant using human genomic DNA. Electrophoresis with a ladder marker gave good results and good separation, as shown in Figure 4, which displays a comparison between agarose 1.5% and the treated food grade agar-agar gel 1.5%, where 5 µl of the marker was loaded into the wells in both gels at 40 V for 5 minutes and 80 V for 2 h followed by 30 minutes of soaking in an ethidium bromide tank. The results showed acceptable efficiency for the treated food-grade agar-agar similar to the efficiency of the agarose gel with some modifications in the method of work. Further enhancements of the images using gel documenting software could even make the separation look clearer for the treated food-grade agar -agar gel.

Fig. 2. 5 different gels pictured after electrophoresis, they contain a loading dye made from bromophenol blue and glycerol and ddH2O along with the DNA sample, here the gels are presented as follows: (A) human genome samples on corn starch gel 12 % in wells from 1 to 4, (B) human genome samples on agar – gelatin mixture gel 1% in wells from 1 to 4, (C) human genome samples on agar gel 1% in wells from 1 to 4 and Ladder in the fifth, (D) human genome samples on agarose gel 1% in wells from 1 to 4 and Ladder in the 5 lane – positive control, (E) human genome samples on treated food grade agar – agar gel 1.5 % in wells from 1 to 4 and Ladder in the 5th lane.
 Fig. 3. Comparison of gels viewed under UV radiation after electrophoresis, (A) human genome samples on corn starch gel 12 % in wells from 1 to 4, (B) human genome samples on agar – gelatin mixture gel 1% in wells from 1 to 4, (C) human genome samples on agar gel 1% in wells from 1 to 4 and Ladder in the 5 lane, (D) human genome samples on agarose gel 1% in wells from 1 to 4 and Ladder in the 5th – positive control, (E) human genome samples on treated food grade agar – agar gel 1.5 % in wells from 1 to 4 and Ladder in the 5th lane.
Fig. 3. Comparison of gels viewed under UV radiation after electrophoresis, (A) human genome samples on corn starch gel 12 % in wells from 1 to 4, (B) human genome samples on agar – gelatin mixture gel 1% in wells from 1 to 4, (C) human genome samples on agar gel 1% in wells from 1 to 4 and Ladder in the 5 lane, (D) human genome samples on agarose gel 1% in wells from 1 to 4 and Ladder in the 5th – positive control, (E) human genome samples on treated food grade agar – agar gel 1.5 % in wells from 1 to 4 and Ladder in the 5th lane.
Fig. 4. Electrophoresis on 1.5% treated food grade agar-agar gel in side with 1.5% agarose gel electrophoresis, both using 50 bp ladder separated, it is clear that agarose is more contrasted and clear than treated food grade agar-agar gel using SB electrolyte, but results are comparable.

DISCUSSION

This research addressed finding a frugal alternative for agarose used in agarose gel DNA electrophoresis. The alternatives experimented in this research included: Agar, which originated in Japan in 1658. It was first introduced in the Far East and later in the rest of agarophyte seaweed-producing countries [29]. Agar is obtained from various genera and species of red–purple seaweeds—class Rhodophyceae—where it occurs as a structural carbohydrate in the cell walls and probably also plays a role in ion-exchange and dialysis processes [30]. Agar is a natural polymer commonly used in various fields of application, ranging from cosmetics to the food industry [31]. It is a gel forming polysaccharide with a main chain consisting of alternating 1,3-linked β-d-galactopyranose and 1,4-linked 3,6 anhydro-α-l-galactopyranose units [32]. Agarobiose is the basic disaccharide structural unit of all agar polysaccharides. Agar can be fractionated into two components: agarose and agaropectin [33]. The food-grade agar results were similar to agar results, yet microbiological agar can be more costly compared to food-grade agar-agar, and the treatment of agar with different salts described in this method gave slightly better results from previous research [12]. We also tested Starch, which is a major food source for humans. It is produced in seeds, rhizomes, roots, and tubers in the form of semi-crystalline granules with unique properties for each plant [34]. Edible and industrial corn starch was modified and used to prepare the electrophoresis gel. Corn starch is composed of two large α-linked glucose-containing polymers. Namely, smaller and nearly linear amylose and very large and highly branched amylopectin [35]. The starch alternative gel didn’t give good results and it was difficult to handle and too thick, so no DNA bands appeared [13]. Another alternative tested was Gelatin, which is a protein obtained by partial hydrolysis of collagen, which is the chief protein component in the skin, bones, hides, and white connective tissues of the animal body [36]. We can conclude from the gelatin gel result that it is not a good candidate for DNA gel electrophoresis, and this has been the case since the late 1980s.[11] From the results shown in Fig. 1, we can conclude that modifying the materials concentration allows us to control the structural and solidification properties. It is important to consider the appropriate gel concentration for the gel’s retinal structure, which is where electrophoresis samples pass, and this is in accordance with Bertasa et al. 2020 research that describes a stronger gel formation and crosslinks with increasing the concentration and anhydro units in the gel in addition to alterations of appearance and color, yet this didn’t apply to gelatin and starch where gelatin lacked the strength to solidify and the starch was too thick and difficult to handle after pouring because it solidified very quickly. [37] We can observe that the previously mentioned gels in Fig. 2 resulted in the electrophoresis of dyes at least, and this is logical because these gels create a charge neutral trap for the negatively charged loading dye to pass through in the presence of an electric field and an electrolyte. [38] From our results shown in Table 1, treated food grade agar-agar gel prepared with sodium bicarbonate solution was the most closely related alternative to the commonly used agarose gel with modifications in the working method to achieve very close results with agarose, while starch gel failed to give a proper result. Also, the mixture didn’t give a clear result because the DNA samples couldn’t get out of the wells. Agar gel, the same as agar – agar gel, gave results similar to those of agarose. But still, treated agar – agar gel showed better results than agar gel by the distance crossed by the DNA samples and the display of the samples, in addition to the low cost. This result of genomic DNA electrophoresis is well known and is confirmed by several previous researches, such as Green et al. 2019, where large genomic DNA fragments migrate slower than smaller fragments, and smearing marks in the resulting gel image refer to poor-quality DNA or electrophoresis conditions. [39] As for cost, 1 g of agarose costs around 35,000 Syrian pounds, while 1 g of agarose costs almost 2000 Syrian pounds, while 1 L of TBE 1x costs nearly 700,000 Syrian pounds, while SB buffer roughly costs 3500 Syrian pounds for the same amount, this makes this alternative 15 times cheaper than agarose gel, and 200 times cheaper for the electrolyte used. It seems from Fig. 4 that the treated food grade agar-agar can show strong bands from the ladder, and the separation requires more time; hence, it could be recommended to use it for PCR products of one band and a ladder with several strong bands, and the background fluorescence from ethidium bromide on the treated gel could mean that there should be more rinsing time for it, in order to give clearer bands.

Conclusions and Recommendations

This study offers a very low-cost alternative to agarose gel to help laboratories with limited income. We found that treated food grade agar-agar could give similar results to those of agarose gel, and by using other buffers for electrolyte like SB buffer. Based on the results of this study, this method provides a low-cost alternative to agarose and TBE & TAE, and it can be used by low-budget labs with limited budgets to make DNA assays more domesticated, where the alternatives suggested here cost 15 times less than the industrial agarose and electrolytes. Further research is recommended to enhance the clarity of the gel and explore the potential applications of this new gel in RNA separation and plasmid DNA separation and PCR amplicons of different lengths.

Simulating The Effect Of The Mechanical Behavior Of The Crankshaft In Internal Combustion Engines Under The Influence Of A Range Of Materials

Investigating Technological Mathematical Knowledge Within the TPACK Framework: A Case Study of Syrian Math Teachers

INTRODUCTION

Our modern age is characterized by rapid and tremendous development in science and technology. Each learner has a smartphone and accessing the internet has become a daily need, a habit for some of us, and a source of income for others. And the development of (5G) networks that revolutionized technology and social networking for people and devices “Internet of Things”. This has led to the imposition of modern requirements to prepare the individual to keep pace with the developments of this era in all the fields related to our lives. One of the most important fields is education, especially in mathematics because of its importance in the different fields of life, computer science and especially algorithms. With the advent of technology, mathematical technologies appeared in education and proved their feasibility; the use of technological innovations in teaching math prepares learners for a High-Tech centric world and develops higher mental cognitive skills, such as problem-solving, thinking, data collecting, analysis and proof. Which fall within the scope of creativity and invention [1]. Fields of mathematical technology have diversified following the technological development of computers, mobile phones and the software used in them in addition to other technologies such as interactive whiteboards, the spread of the Internet and the educational services and platforms it provides. Mathematicians were able to use all these technologies in teaching mathematics. The benefits of mathematical technology are not just for students, it has an impact on teachers as it supports the creativity of teachers as learners and task designers and provides the opportunity to develop many new mathematical meanings [2]. Several scholars have investigated the technological pedagogical content knowledge (TPACK) for math teachers. Alternatively, a subset of them: Mailizar and Fan (2019) investigated Indonesian math teachers’ technological pedagogical content knowledge. The study used a questionnaire, and the sample consisted of (341) math teachers. The results showed that the understanding of mathematical technology ranked low and suggested more training courses for teachers [3]. In Malaysia, Bakar, Maat and Rosli’s (2020) study aimed to determine the math teacher’s self-efficacy in integrating technology and (TPACK). The study used a questionnaire containing (71) items, and the sample consisted of (66) national secondary math teachers. The results showed no gender or educational experience differences [4]. In Kenya, Mukenya, Martin and Shikuku (2020) investigated the knowledge and skills of math teachers to integrate ICT into secondary school education. The study used a questionnaire, and the sample consisted of (218) math teachers and heads of departments. The results indicated that teachers need more knowledge and skills to use ICT. They suggested that the Ministry of Education should work on policies to develop teachers’ ICT pedagogy and review the curriculum [5]. In Spain, the study of Gómez-García, Hossein-Mohand, Trujillo-Torres and Hossein-Mohand (2020) investigated the training and use of ICT in teaching mathematical concepts. The study used a questionnaire, and the sample consisted of (73) high school math teachers. The results showed differences in favor of teachers with less education experience and no gender differences [6]. Spangenberg and De Freitas (2019) in South Africa investigated the levels of (TPACK) and ICT integration barriers. The study used a quantitative questionnaire, and the sample consisted of (93) math teachers. The results showed poor technological content knowledge and suggested continuous professional development programs for teachers in specific ICT integration [7]. In Turkey, the study by Ozudogru and Ozudogru (2019) investigated math teachers’ technological pedagogical content knowledge. The study used a questionnaire containing (39) items, and the sample consisted of (202) math teachers. The technological knowledge section results showed significant differences in gender in favor of males and no differences in teaching experiences or school level [8]. In addition, the study of Birgin, Uzun and Akar (2020) investigated Turkish mathematicians’ perceptions of their proficiency in using ICT in teaching. The study used a descriptive survey; the sample consisted of (242) math teachers. The results showed that teachers’ knowledge of mathematical software is low, and there are no gender differences. However, there are differences in favor of teachers with less experience in education in terms of efficiency [9]. In China, Tan and Jiang (2021) aimed at the mathematical technological knowledge of elementary school math teachers. The study adopted the qualitative paradigm and a sample of (24) math teachers. The results showed that the teacher’s knowledge and use of technology classification are good. The previous research has yet to study the relationship between teachers’ knowledge and teachers’ training courses, academic qualifications, and teachers’ Internet access. Accordingly, this study will contribute to bridging this research gap.

Technological Mathematical Knowledge (TMK)

In 1986, Shulman came out with the (Pedagogical Content Knowledge) framework, which teachers need in terms of knowledge and tools to teach specific content. He considers educational technology a tool that facilitates teaching [11]. After the advent of E-learning and E-class design, Kohler and Mishra 2006 added technology as an independent regard of knowledge and not as a helping tool for teaching; (Technology knowledge) is the knowledge of technologies involving the skills of operating and using the old and new of them [12]. Also, they define the concept of (Technological Content Knowledge) as “an understanding of how teaching and learning can change when particular technologies are used in particular ways.” [13, p 65]. Thus, Schulman’s framework was expanded to (Technological Pedagogical Content Knowledge), which aims to demonstrate the necessary competencies for teachers to integrate technology with education [12]. Koehler and Mishra (2009) have embodied the framework in the “What is TPACK” study. The framework was a schematic illustrating the intersection of the three pieces of knowledge within the framework and the new knowledge resulting from its meeting with seven pieces of knowledge. As a result of the development of educational sciences and technologies, researchers [10,14,15] customized the content in the (TPACK) framework to include only mathematical content. [14] developed the Technological Pedagogical Mathematical Knowledge (TPMK) concept. [15, p 1] used the (Mathematical Technological Knowledge) concept, which they define as a “teacher’s knowledge of the technology developed as a result of exploring mathematics with technology”. This concept has an issue because some technologies are not just mathematical like an interactive whiteboard or Google apps. Similarly, [16, p 342] used the (Technological Mathematical Knowledge) concept, which they define as “the teacher’s knowledge of technological tools that can be used to represent mathematical knowledge”. However, [3, p 5] defines the broader concept of ICT-content knowledge as “knowing how to use ICT to represent, communicate, solve and explore mathematical contents, ideas, or problems without consideration of teaching approaches”. Taking advantage of these definitions, this paper defines (Technological Mathematical Knowledge) as knowledge of educational technologies hardware- and software along with how to use them to represent, explain, solve and explore mathematical content, ideas or issues regardless of the educational pedagogy, ” how to make a circle within a triangle using GeoGebra” [16, p 2].

Educational Technologies for Mathematics

Interactive Whiteboards

An interactive whiteboard is a versatile tool that allows teachers to deliver engaging lessons using various applications and educational programs [17]. Studies show it improves students’ math achievement [18]. And can benefit displaced learners in challenging environments.

Computer Algebra Systems: One of the most prominent software applications is GeoGebra. It can solve quadratic equations by graphing and accurately representing geometric transformations, statistical representation and data analysis, providing an interactive geometric environment for learners and representing shapes with a 3D environment; meanly, learning by GeoGebra improves the geometrical abilities of students [19]. In addition to its positive impact on achievement [20], it is also one of the best technological options that enriches the quality of research and mathematical conception from different perspectives that support feedback. It also provides strategies for teachers to teach according to students’ needs and facilitates learning through virtual representations that represent reality and focus on educational benefits [21]. Thus, the use of GeoGebra has a significant impact on mathematical abilities [22]. Another example is Sketchpad which combines geometry designs with algebra and calculus, curves representing descendants, then algebraic representation such as coordinates or equations and finally, a data table representation [23]. Sketchpad shares the advantage of learning through practice and developing the learner’s ability to use these applications with GeoGebra on smartphones [24].

Coding language: Scratch, for example, is a straightforward and exciting initial learning tool for understanding basic programming principles, creating educational and recreational content, building mathematical and scientific projects and simulating and visualizing experiments. Scratch not only allows learning math in an easy, effective and exciting way, but teachers also use it to teach basic mathematical principles of arithmetic and geometry [25]. In short, scratch is superior to other programming languages by attracting children to learn programming in the future [26].

Smartphone apps: are a form of distance learning and an extension of E-learning. Teachers can provide math content and follow learners anywhere, anytime by designing high-quality digital learning objects in math. Students can also learn mathematical content according to their circumstances and needs [27]. Moreover, the smartphone was the best technology for teachers during the COVID-19 pandemic [28]. It also supports applications such as Kahoot, a free educational program that supports many languages, such as Arabic, based on the play-and-response classroom system. It also helps students learn and self-evaluate, better demonstrate what they have learned, make math more exciting and vital and increase motivation to learn [29].

Online Tools: The field of education has been revolutionized by two powerful types of tools. The first type is the learning management system, such as MOODLE, an open-source program utilized in over 235 countries to support the E-learning process. Particularly effective in math education, MOODLE encourages learners to engage in cognitive thinking skills and fosters the generation of new ideas [30]. The second type is online learning resources, including Massive Open Online Courses (MOOCs), which cater to both teachers and students. These resources that are available through platforms like Coursera, Alison, Udemy and others, offer high-quality content in various specialties such as mathematics, computer science and languages. MOOCs have proven to be an invaluable resource, helping teachers enhance their professional knowledge and enabling students to access a wide range of courses, including specific mathematics courses [31], through platforms like Coursera, EdX and others. These platforms provide videos that can effectively supplement classroom learning, allowing teachers to explain complex concepts more easily.

The war in Syria had a significant impact on the education sector; it destroyed schools and displaced students, which led teachers to adopt unconventional education methods even before the COVID-19 pandemic, which was the first real challenge to educational technologies. According to McGonigal (2005) as cited in [32, p 49]“Teachers need an activating event to expose the limitations of their current knowledge”. So, what event is more challenging than war or a pandemic?

This phenomenon raises a controversial issue; did teachers have the knowledge and skills to help them cope with this crisis? And how did their knowledge and skills develop after the crisis? The current study aims to classify the technological mathematical understanding of Syria’s math teachers and the effects of demographic variables. Consequently, two questions and five related null hypotheses were formed for demographic variables, as follows:

  • What is the classification of Syrian math teachers’ technological mathematical knowledge?
  • Are there statistically significant differences in teachers’ technological mathematical knowledge according to gender, academic qualification, years of experience, training courses, and Internet access?

METHODS

Participants

The online survey was shared in a Facebook group for Syrian math teachers. The researcher used the approval of the Ethics Committee of the Ministry of Education. Data was collected in the second semester of the 2021-2022 academic year. The sample was limited to (219) teachers, as shown in Table 1.

Tools

The study used a questionnaire based on [3]. The validity of the study tool was confirmed using an independent T-test and the reliability was assessed with a Cronbach-Alpha coefficient value of 0.859. Its items were classified into two parts; the first included demographic information, including gender, academic qualification, years of experience, established courses and Internet access. Part two: aimed at Technological Mathematical Knowledge, consists of (3) items intended for knowledge of educational devices, (4) items aimed at general understanding of software, (4) items aimed at knowledge of computer mathematical software, (4) items aimed at knowledge of Smartphone tools, two items on knowledge of online tools, (7) items aimed at mathematical technology content knowledge at levels:( strongly disagree, disagree, neutral, agree, strongly agree)

Data Analysis

In this study, the researcher used SPSS for statistical analysis, including coding responses into a five-point scale, calculating averages and standard deviations, conducting T-tests for validity, gender, and internet access, applying Cronbach’s alpha for reliability, using ANOVA for comparing mean responses in the case of (Academic qualification, courses, and Years of experience), and performing Fisher’s LSD test. All hypotheses were tested at a significance level of α=0.05.

RESULTS

Technological Mathematical Knowledge (TMK) of Syrian Math Teachers

Table (2) shows that the mean score of teachers’ knowledge of hardware was (3.37), which is higher than the average. In addition, their mobile knowledge was higher than their computer and interactive whiteboard knowledge, and the mean score of teachers’ knowledge of general software was (3.14), and the table shows that knowledge of Microsoft applications was the highest with average (3.92), the average knowledge of mathematical software was (2.53) which is below average, dynamic applications such as GeoGebra appear as the highest mean (2.84), the mean score of mobile tools was (3.47), which is higher than the average, and social media apps show the highest mean score (3.84), the mean score of online tools was (2.70), but the mean score of using mathematical technology was (2.30), which is below the average, and the highest field of use was in geometry with an average of 2.41.

The Effects of Demographic Variables on Technological Mathematical Knowledge.

Gender differences in teachers’ (TMK)

Table 3 shows the results of an independent sample t-test comparing the means of teachers’ technological mathematical knowledge based on gender. The table shows that the mean score for male teachers is 3.13 and the mean score for female teachers is 2.75, the t-value is 3.922. A higher t-value indicates a larger difference between the means, the significance level of less than 0.05 is typically considered statistically significant. In this case, the significance level is 0.000, which is less than 0.05. Based on the t-test results, we can reject the null hypothesis that there is no difference between the means of technological mathematical knowledge scores for male and female teachers. So, there is a statistically significant difference between the means, with male teachers scoring higher on average than female teachers.

Academic qualification differences in teachers’ (TMK)

The results of the one-way ANOVA analysis in Table 4 indicate a statistically significant difference (p < 0.05) in technological Mathematical Knowledge scores between teachers with different academic qualifications. This means that we can reject the null hypothesis that there is no difference in scores between the groups.

Further analysis using the LSD test in Table 5 helps pinpoint which specific groups differ from each other. The LSD test reveals significant differences in technological proficiency scores between the following groups:

  • Diploma and bachelor’s degree holders (average difference: -0.25268 & Sig = 0.193)
  • Diploma and master’s degree holders (average difference: -0.5207 & Sig = 0.015)
  • Master’s and bachelor’s degree holders (average difference: 0.2680 & Sig = 0.028)

the researcher concludes that there are statistically significant differences in teachers’ (TMK) based on academic qualification in favor of the master’s degree group. At the same time, there were no differences between the bachelor and diploma groups.

Training courses differences in teachers’ (TMK)

The results of the one-way ANOVA analysis in Table 6 indicate a statistically significant difference (p < 0.05) in Technological Mathematical Knowledge scores between teachers with different training courses. This means that we can reject the null hypothesis.

The LSD test in Table 7 reveals significant differences in technological proficiency scores between the following groups:

  • No Courses and Technology Integration Courses (average difference: -0.09665& Sig = 0.370)
  • No Courses and MOOCs (average difference: -0.50209& Sig =0.001)
  • Technology Integration Courses and MOOCs (average difference: -0.40554& Sig = 0.006)

the researcher concludes that there are statistically significant differences in teachers’ (TMK) based on Training courses in favor of the MOOCs group. At the same time, there were no differences between the No Courses and Technology Integration Courses groups.

Years of experience differences in teachers’ (TMK)

The results of the one-way ANOVA analysis in Table 8 indicate a statistically significant difference (p < 0.05) in Technological Mathematical Knowledge scores between teachers with different Years of experience. This means that we can reject the null hypothesis.

The LSD test in Table 9 reveals significant differences in technological proficiency scores between the following groups:

  • 1-7 years and 8-14 years (average difference: 0.48341& Sig = 0.007)
  • 1-7 years and 15 years and more (average difference: 0.39751& Sig = 0.002)
  • 8-14 years and 15 years and more (average difference: -0.68713& Sig = 0.280)

The researcher concludes that there are statistically significant differences in teachers’ (TMK) based on Years of experience in favor of the 1-7 years group. At the same time, there were no differences between the -14 years and 15 years and more groups.

Internet access differences in teachers’ (TMK)

Table 10 shows the results of an independent samples t-test comparing the means of teachers’ technological mathematical knowledge based on Internet access. The mean score for 3G/4G Network is 2.43 the mean score for ADSL Network is 3.85, t-value is 3.734 & (p = 0.000 < 0.05). Based on the t-test results, we can reject the null hypothesis. So, there is a statistically significant difference between the means in favor of the ADSL Network.

DISCUSSION

Results of the study showed that the general knowledge about devices was slightly above average and that a higher percentage of math teachers used smartphones because it is easy to use and widely available among learners in WhatsApp and Facebook groups as indicated in [9]. This result contradicts [3], where the highest percentage was computers. However, the researcher added an interactive whiteboard instead of the graphing calculator in our study. Our study indicates that Syrian math teachers’ general software knowledge ranked slightly above average. The highest percentage was Microsoft applications because it is familiar and easy to use and its training courses are easily accessible (ICDL). In this section, our findings are consistent with the results of [3, 9, 5], and add a section for smartphone applications, consistent with [33] in the excellent degree of using the WhatsApp application. Within the knowledge of mathematical software, the highest percentage was for GeoGebra. The reason might be to support the Arabic language and for its easy-to-use qualities. Besides, smartphone applications were more elevated than computer applications. As for Internet tools, knowledge of learning resources such as Coursera was higher than knowledge of learning management systems. This result contradicts [3] during a pre-COVID-19. This difference indicates that teachers use smartphones directly as an educational tool or a learning resource in times of crisis. The results showed poor use of mathematical technologies; a possible explanation might be that teachers are not well qualified for these technologies and not good enough at English. Another possible explanation is that most educational technological devices are unavailable in schools because the Ministry does not provide schools with such devices, which may be due to their high cost and the difficulty of producing them locally, along with the circumstances of war. This conclusion supports [5], which linked poor knowledge and use to the unavailability of technologies and devices in schools. On the other hand, [10] ranked the expertise and use of technology by Chinese math teachers as good and the integration of technology with education as excellent, owing to the availability of devices in Chinese schools.

Gender: There were significant differences in teachers’ (TMK) based on gender in favor of the male group, and this might be due to female teachers being busy with their household duties, so they do not have time to learn or use modern technological skills, unlike male teachers who have time to learn and use new technologies. This conclusion supports [8], which explains that male students tend to be more technological than female students who want to study languages and social sciences. This result is contrary to [9, 34, 6] where they showed no gender differences.

Academic qualification: There were significant differences in teachers’ (TMK) based on academic qualification in favor of the master’s degree group; a possible explanation is that master’s degree holders have excellent English and research skills. Besides, a good relationship with the Internet and all the new technologies in their specialties. As Patalinghug and Arnado [35, p 585] have pointed out “It would be a good practice for teachers to pursue advanced degrees like master’s degrees or even higher degrees” unlike the teachers who stopped at the bachelor’s or diploma, as they do not require development or scientific research. He satisfied himself with his job as a middle or secondary teacher, which does not require technical skills in our schools, [36] recommended a bachelor’s degree program should be redefined with smart technologies so students can learn fast and subjectively. Teachers might also need more time to master new technology. As [37, p 9] has mentioned, “Teachers may also feel that they do not have the time to learn new technologies because there have been many changes to middle and high school math courses and curriculum over the past several years”.

Training courses: There were significant differences in teachers’ (TMK) based on training courses in favor of the MOOCs group. This result might be because mathematical technologies are still new; therefore, they need advanced techniques that are not available in the ministerial integration courses. Logically this result supports the impact of MOOCs on teachers’ professional development and technological skills, as the studies of [38, 39] have indicated. In the USA, researchers have tested MOOCs as a teacher training course that provides content-focused experiences using technology. Expert trainers successfully designed exciting experiences for teachers that positively affected their perspectives, practices and beliefs in math teaching and statistics [39]. MOOCs worldwide allow teachers to forge partnerships and create learning communities that improve their professional knowledge and skills [40].

Years of experience: There were significant differences in teachers’ (TMK) based on years of experience in favor of the ‘1-7 years’ group. These teachers started their careers in the harshest circumstances of the war and then the COVID-19 pandemic. So, this shows that they were more resilient to learning modern technologies that helped them overcome these conditions. This result is consistent with [6], which explains that teachers with less education experience have better training in ICT and use it broadly. However, this result contradicts [8, 34], where they showed no years of experience differences.

Internet access: There were significant differences in teachers’ technological mathematical knowledge based on Internet access in favor of (ADSL); a possible explanation is that (ADSL) is more stable and cheaper in developing countries like Syria. Therefore, it allows teachers to comfortably explore the Internet, enroll in any course, such as a course on Coursera, and watch a large number of instructional videos on YouTube, unlike the limited access (3G/4G).

CONCLUSION AND RECOMMENDATIONS

The present research aimed to classify the technological mathematical knowledge of Syrian math teachers. The results showed that its classification is below average, with the highest percentage of smartphones and their mathematical applications. In the face of unprecedented challenges like war and pandemics, teachers must remain committed to developing themselves and their skills. Our research reveals a powerful tool for overcoming these obstacles: a strong relationship with the internet. By leveraging the vast resources available online, teachers can advance their mathematical and technological knowledge and equip themselves to better serve their students. This is a critical time for educators to embrace the power of technology and chart a path forward to a brighter future. This paper suggests that Ministries of Education develop comprehensive teacher training programs to prepare teachers for crises like war or pandemics. These programs should focus on developing teachers’ skills in modern mathematical software tools, mathematical applications, social media platforms, distance learning platforms, interactive lessons and E-testing. They can be extended to cover other educational subjects and mathematical technologies should be introduced to build the technological mathematical knowledge of graduates. Finally, teachers’ access to the Internet must be supported. These measures will ensure quality education during crises.


About The Journal

Journal:Syrian Journal for Science and Innovation
Abbreviation: SJSI
Publisher: Higher Commission for Scientific Research
Address of Publisher: Syria – Damascus –Ministry of Higher Education and Scientific Research

ISSN – Online: 2959-8591
Publishing Frequency: Quartal
Launched Year: 2023
This journal is licensed under a: Creative Commons Attribution 4.0 International License.


Upcoming Events