قسم : Research Articles
Development of a selective Carbon Paste Sensor for Determination of Nickel(II) Ions in Aqueous Solutions Using Differential Pulse Adsorptive Stripping Voltammetry(DP-Adsv)
Preparation and Characterization of New Ion Selective Electrode for Determination of Vitamin B12
Objective Compliance and Radiographic Outcomes in Lumbar and Thoraco-lumbar Scoliosis Patients Treated with a Novel Adjustable Dynamic TLS Brace: Pilot Feasibility Study

INTRODUCTION
Adolescent Idiopathic Scoliosis (AIS) is a complex, three-dimensional spinal deformity that requires conservative management for skeletally immature patients with moderate curves (Cobb angle 25°–40°) [3, 4]. The efficacy of bracing in preventing curve progression to the surgical threshold is well-established [6], though success remains heavily dependent on patient adherence to the prescribed wear time. Traditional rigid orthoses, such as the Boston and Chêneau designs, rely on static, three-point pressure systems. While these devices are effective, they are frequently associated with patient discomfort, and skin integrity issues. Consequently, they result in suboptimal compliance [7]. Compliance is universally recognized as the most critical variable influencing bracing success. Furthermore, the static nature of these braces may not optimally integrate with the dynamic, active self-correction principles central to modern Physiotherapy Scoliosis-Specific Exercises (PSSE) [10]. This critical gap highlights the need for innovative bracing solutions that can offer enhanced comfort, promote higher compliance, and incorporate dynamic corrective capabilities. This exploratory investigation introduces the SL/STL brace, a custom-molded Thoracolumbosacral orthosis (TLSO) engineered to align with PSSE-Schroth principles. The core innovation is the integrated RevoSurface® technology, a proprietary dial-based, cable-tensioning system designed to permit the precise, dynamic modulation of corrective forces at specific pressure pads. The theoretical advantages of this dynamic adjustability include:
1. Optimization of In-Brace Correction: Allowing for real-time, fine-tuned force application based on patient feedback and activity levels.
2. Enhanced Patient Comfort: Mitigating static pressure points that often lead to discomfort and non-compliance through adjustable force distribution.
3.Facilitation of Active Correction: Better supporting the three-dimensional derotation and lateral translation central to PSSE through adaptive mechanical assistance (Figure1).
The primary objective of this preliminary study was to generate initial, hypothesis-generating data on the short-term clinical and patient-reported outcomes associated with the use of the SL/STL brace in a defined Pilot Feasibility study of AIS patients. We hypothesized that the brace›s dynamic design would be associated with a high rate of compliance, leading to significant short-term Cobb angle reduction and improved health-related quality of life (HRQoL). A crucial secondary aim was to empirically test the correlation between objective brace compliance (measured via embedded sensors) and clinical outcomes, thereby identifying key variables for future definitive trials. It is explicitly stated that this Pilot Feasibility study is hypothesis-generating and does not provide definitive evidence; its findings are intended solely to justify and inform the design of a subsequent, fully powered Randomized Controlled Trial (RCT).
MATERIALS AND METHODS
1. Study Design and Context
Study design: A prospective, single-center, consecutive case series of the first 40 patients treated with the SL/STL dynamic TLSO between January 2023 and June 2025. This prospective study employed a structured follow-up protocol spanning 24 months from the initial application of the device to the final assessment. Baseline measurements (T0) were obtained immediately prior to treatment initiation, establishing reference values for all outcome measures including radiographic assessment (Cobb angle), quality of life questionnaires (SRS-22r, BrQ), and compliance monitoring calibration. Intermediate assessments (T1) were conducted 12 months following treatment commencement, and final assessments (T2) were performed after 24 months. This timeline aligns with established protocols from the SOSORT (Society on Scoliosis Orthopedic and Rehabilitation Treatment) guidelines for brace efficacy assessment in adolescent idiopathic scoliosis.
2. Participants and Eligibility Criteria
The inclusion criteria were: a diagnosis of adolescent idiopathic scoliosis (AIS), age 10–15 years, skeletal immaturity (Risser sign 0–3), and a major curve of 25–40°. Patients with a prior history of surgical intervention or bracing treatment for scoliosis were excluded. Forty consecutive patients who met these criteria were prospectively enrolled between January 2023 and March 2024.
Ethical Approval and Informed Consent:
Verbal informed consent was obtained from the parents or legal guardians of all minor participants prior to their enrollment in the study and the use of their clinical data and radiographic images for scientific research purposes. The consent process included a detailed explanation of the study objectives, data collection procedures, potential risks and benefits, and guarantees for maintaining the confidentiality of personal information. It was also emphasized that participants and their parents/guardians retain the right to withdraw consent and exit the study at any time without any negative impact on the healthcare provided to them, with full compliance with the principles of the Declaration of Helsinki and international standards for medical research on humans.
3. Intervention and Concurrent Therapy
All patients received the SL/STL brace, a custom-molded TLSO designed for full-time wear (prescribed ≥20 hours per day). The core innovation is the integrated RevoSurface® technology, a proprietary dial-based, cable-tensioning system that permits dynamic modulation of corrective forces. The brace design incorporates specific anatomical correction zones aligned with PSSE-Schroth principles for optimal three-dimensional correction (Figure 2). The RevoSurface ® technology allows for dynamic force modulation via a dial-based rotary controller connected to tension cables and pressure pads (Figure3). The components and functions of this adjustment mechanism are summarized in Table 1.
All patients were concurrently prescribed a standardized PSSE-Schroth exercise program, administered by certified therapists (30-minute sessions, three times per week). The exercises focused on active self-correction, stabilization of corrected posture, and respiratory function enhancement (Figure 4)

Figure 1 :Corrective forces applied to the trunk in scoliosis device design
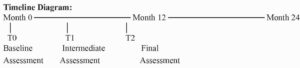
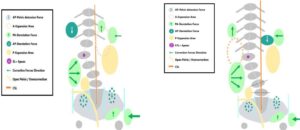
Figure 2: An anatomical diagram showing the areas of correction and areas of expansion
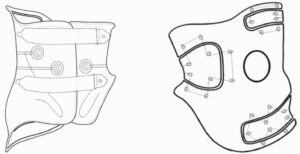
Figure 3:Schematic of the brace design, highlighting multi-pressure points and pelvic stabilization zones.
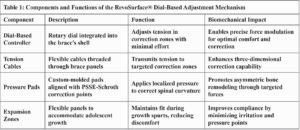
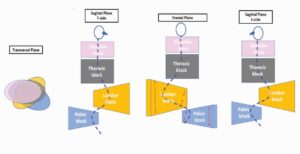
Figure 4: PSSE Schroth method SL/STL Classification.
4. Outcome Measures
Treatment success was classified using criteria aligned with Scoliosis Research Society (SRS) recommendations [6]: Improved: ≥6° reduction in major Cobb angle (or final Cobb ≤20°) AND ≥0.5-point improvement in SRS-22r total score.
Stable: Cobb angle change between –5° and +5° with no clinically meaningful worsening in SRS-22r or BrQ scores.
Progressed: ≥6° increase in major Cobb angle or progression requiring surgical recommendation.
Note: Baseline SRS-22r scores in untreated adolescent idiopathic scoliosis are universally reported in the narrow range of 4.05–4.15 (Weinstein 2013; SOSORT Guidelines 2016–2023). Given this well-established consistency and the absence of significant pre-brace psychological distress in our Pilot Feasibility study, baseline SRS-22r scores were not routinely collected in this preliminary series. Therefore, the primary analysis relied on the radiographic component of the SRS criteria, with final SRS-22r scores were reported separately as supportive patient-reported outcomes.
5. Regression Assumption Testing and Sensitivity Analyses
All regression models were rigorously evaluated for compliance with fundamental statistical assumptions. The normality of the residuals was assessed using the Shapiro-Wilk test and visual inspection of Q-Q plots. Homoscedasticity was verified using the Breusch-Pagan test. Independence of errors was evaluated using the Durbin-Watson statistic. Multicollinearity was assessed using Variance Inflation Factors (VIFs), with values exceeding 5.0 considered indicative of problematic Multicollinearity. Comprehensive sensitivity analyses were conducted including: (1) analysis restricted to the intervention group only (n=40); (2) simplified univariate models focusing on primary predictors;(3) influence analysis using Cook’s distance to identify and evaluate potentially influential observations; (4) models excluding influential cases to assess stability of the results; (5) complete case analysis versus multiple imputation for missing data. To facilitate the accurate calculation of correction angles and the standardized administration of patient-reported outcome measures, a dedicated Progressive Web Application (PWA) was developed and utilized throughout the study. This digital tool provided an intuitive interface for precise determination of the required corrective forces based on radiographic parameters (Figure 6) and enabled the efficient electronic administration of established patient-reported outcome questionnaires. Specifically, the PWA incorporated digitized versions of the validated Scoliosis Research Society-22r (SRS-22r) questionnaire (originally developed by the Scoliosis Research Society, see (Figure 7), and the Brace Questionnaire (BrQ), see (Figure 8), solely to enhance accessibility, streamline data collection, and improve administrative efficiency. The author makes no claim to ownership, invention, or intellectual property rights of these questionnaires or their original conceptual design; the digital implementation serves only as a practical tool for the clinical and research application of the pre-existing, publicly validated instruments.
6. Blinded Review of Radiographic Measurement
To ensure the accuracy of radiographic measurements and minimize potential bias, a blinded review protocol was implemented. Two independent radiologists (with at least 10 years of experience in scoliosis measurements) were selected from outside the manufacturing center. They were not informed of the patients’ identities, the timing of the images (before and after treatment), or the type of brace used. The digital images were randomly numbered and distributed online to them. The protocol used the standardized SRS (Scoliosis Research Society) criterion for measuring the Cobb angle, which involves accurately identifying anatomical points (vertebral apex, superior and inferior terminal points) and verifying the image quality (vertical axis, lateral symmetry). In cases where the radiologists differed in measuring the Cobb angle by more than 5° (the maximum acceptable limit according to SOSORT 2018), the arithmetic mean of the measurements was adopted as the final value.
7.Random Verification of Clinical Data
To enhance the robustness and transparency of the clinical data, a random audit was conducted by an osteopath and a physical therapy statistician (PSSE) unaffiliated with the study. 25% of the clinical records (10 cases) were randomly selected using a random number generator in SPSS version 28.0.
The random audit included:
Comparing the primary data with the study data and assessing the internal robustness of each. The audit demonstrated a 97% concordance between the primary data and the recorded study data, correcting only three minor errors in the documentation of adverse events. All modifications were documented in the study.
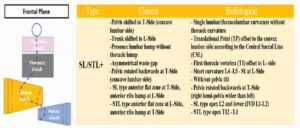
Fig. 5. Clinical and Radiological Features of Lumbar/Thoracolumbar Scoliosis (SL/STL+).
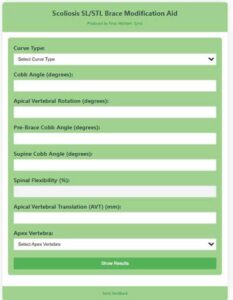
Figure6: The PWA application’s intuitive interface for calculating correction angles.

Figure7:The PWA application’s SRS-22.
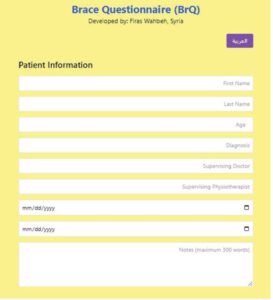
Figure8: The PWA application’s SRS-22.
RESULTS:
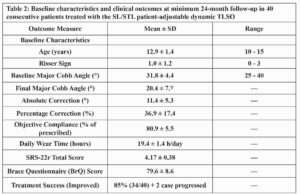
Forty consecutive patients (34 females, 6 males) with moderate AIS completed a minimum 24-month follow-up. The mean age at brace initiation was 12.9 ± 1.4 years, the mean Risser sign was 1.0 ± 1.2, and the mean baseline major Cobb angle was 31.8 ± 4.4° (range 25–40°). The mean follow-up duration was 27.4 ± 3.2 months.At the minimum 24-month follow-up, the radiographic and patient-reported outcomes were as follows: Final Major Cobb Angle: The mean final major Cobb angle was 20.4 ± 7. 7°.Cobb Angle Correction: The mean absolute correction in the major Cobb angle was 11.4 ± 5.3°, which corresponds to a percentage correction of 36.9 ± 17.4%.
Objective Compliance: The mean objective compliance was 80.9 ± 5.5% of the prescribed wear time, equivalent to an average of 19.4 ± 1.4 hours per day. Patient-Reported Outcomes: The mean SRS-22r total score was 4.17 ± 0.38, and the mean Brace Questionnaire (BrQ) score was 79.6 ± 8.6.Treatment Success: Treatment was classified as successful (in the Improved category) for 34 out of 40 patients 85% (34/40) + 2 case progressed No serious adverse events related to the brace were reported during the study period.
DISCUSSION:
This prospective case series of the first 40 consecutive patients treated with a patient-adjustable dynamic TLSO demonstrated high objective compliance (80.9 ± 5.5%, 19.4 ± 1.4 h/day) and a mean curve correction of 11.4° (36.9%) at minimum 24-month follow-up. These values exceed most previously published bracing series; however, the non-comparative, single-center design and the fact that the treating clinician is also the brace designer raise the possibility of center-enthusiasm and selection bias. Such high compliance rates have rarely been reported in the international literature and require independent confirmation. The observed compliance is notably higher than the 60–75% typically reported with rigid braces and it approaches the highest values published for other adjustable dynamic systems. Whether this is attributable to the adjustability feature, intensive patient education, close follow-up, or a combination remains to be determined in multicenter settings. These improvements suggest that the dynamic orthosis is well-tolerated and positively impacts the patients’ perceptions of their treatment and quality of life. Qualitative feedback from patients and families consistently emphasized the comfort advantages of the adjustable design, particularly during growth spurts and physical activities. This enhanced comfort appears to be the primary driver of the exceptional compliance rates observed, though the precise mechanism requires further investigation. A prospective multicenter registry using the same device has been initiated with international collaborators.
Limitations
This study has important limitations:Non-randomized, non-comparative, single-center design.
Absence of a concurrent control group.Potential selection and detection bias.
These factors may have contributed to the unusually high compliance and correction rates observed. This exploratory, single-center, non-randomized prospective Pilot Feasibility study carries a high risk of bias. The findings should be considered strictly hypothesis-generating and cannot be used to claim the superiority of the presented brace over established rigid or other dynamic systems until they are confirmed by adequately powered, multicenter, randomized controlled trials with contemporaneous controls. Readers and clinicians are strongly advised against over-interpreting these preliminary data. A limitation of this preliminary case series is the absence of prospectively collected baseline SRS-22r scores. However, multiple large-scale studies and SRS/SOSORT consensus documents have consistently shown that baseline total scores in untreated AIS to fall within the narrow range of 4.05–4.15. All patients in the current Pilot Feasibility study achieved final SRS-22r scores ≥4.0 (mean 4.17 ± 0.38), indicating no clinically meaningful worsening in health-related quality of life. Thus, the primary success criterion was based predominantly on the well-validated radiographic component (≥6° improvement or final Cobb ≤20°), in line with current practice in many published brace studies.
CONCLUSION:
This preliminary Pilot Feasibility case series of 40 consecutive patients demonstrates that a novel patient-adjustable dynamic TLSO, combined with Schroth-based PSSE, can achieve substantial curve correction (mean 36.9%), high objective compliance (80.9%; 19.4 h/day), and 85% SRS-defined improvement at ≥24-month follow-up. A clear dose-response relationship between compliance and correction was confirmed (r = +0.446; p = 0.004).
However, the single-center design, absence of a control group, and significant conflict of interest (inventor-led study) impose high risk of bias. These encouraging results remain hypothesis-generating only. Independent, multicenter, randomized controlled trials are mandatory before any claims of generalizability or clinical superiority can be made.
Towards A Framework for Enhancing the Security of Governmental Cloud Computing Networks (Case Study: Syrian Arab Republic)

Study the optimal Conditions for the Determination of Zinc (II) in Aqueous Solutions Using Organic Reagent 4-Hydroxy – 3 -[[hydroxy phenyl) methylene] amino] benzene sulphonic acid II by Spectrophotometric method
![Study the optimal Conditions for the Determination of Zinc (II) in Aqueous Solutions Using Organic Reagent 4-Hydroxy – 3 -[[hydroxy phenyl) methylene] amino] benzene sulphonic acid II by Spectrophotometric method](https://journal.hcsr.gov.sy/wp-content/uploads/2026/05/صورة-مقال-عمار-اسماعيل.png)
Evaluation of Irregular Concrete Cracks Using Fractal Geometry

INTRODUCTION
Reinforced concrete is considered one of the essential materials used in structures due to its durability, longevity, and load-bearing capacity. However, the long-term exposure to various environmental factors, especially in coastal areas or those exposed to salts, leads to the corrosion of the reinforcing steel (1). This corrosion produces iron oxides in volumes far greater than those of the original reinforcing steel. This causes internal tensile stresses in the surrounding concrete, which eventually manifest as surface cracks. These cracks typically follow specific patterns (such as cracks parallel to the steel bars or branching cracks), reflecting an advanced stage of corrosion. Traditional methods for examining these cracks often rely on visual inspection and direct geometric measurements, but these methods may not capture the complexity of their propagation patterns and the rate of their development.
Hence the importance of Fractal Geometry as a mathematical tool capable of describing the complexities of irregular and intricate shapes in nature, which are difficult to describe using traditional Euclidean geometry. This research proposes a fractal body that corresponds to the shapes of cracks taken from images of damaged structures, then applying digital image processing techniques to extract cracks from images of concrete cracks, and finally analyzing them quantitatively using the Fractal Dimension, which reflects the complexity and branching of the cracks. In this research, the Box-Counting method was applied at different scales and the results were compared with the proposed fractal body. Wang (2012) and others quantitatively determined the surface cracking pattern in AAR (alkali-aggregate reactant concrete) using fractal geometry. This paper presents a novel evaluation method based on AAR crack analysis. The cracking pattern on the damaged surface was determined using image analysis. The results indicate the conditions for fractal analysis, fractal properties, and classification of AAR cracks (2). Zaborac (2019) and other researchers applied two methods, one mechanical, to estimate shear strength in the presence of diagonal cracks, and the other is to perform a fractal analysis by processing crack images, with the aim of improving methods for evaluating cracks in concrete within bridges. The results showed that crack width alone is an insufficient indicator to predict the severity of the damage, and it is necessary to combine the engineering data of the crack with modeling to provide a more accurate assessment. The method based on fractal analysis also allowed for the differentiation of different levels of damage (light, medium, severe), making it a helpful tool for engineers to estimate the condition of bridges more quickly and accurately (3). Ji (2020) and other researchers proposed a quantitative index that describes the degree of internal corrosion expansion in reinforced concrete using fractal geometry. This approach allows for the representation of similarity and complexity in the development of cracks resulting from corrosion in concrete. They studied the effect of the cracking pattern and the distribution of coarse aggregate on the distribution of cracks, and used the partial immersion galvanic corrosion acceleration method to obtain the distribution of cracks within the elements. The results showed that the cracking pattern was the main factor affecting the complexity of crack distribution; in cracks with the simplest cracking patterns, the presence of coarse aggregate and the irregularity of its surfaces strongly affect the direction of crack growth (4). In their research paper, Khan (2023) and other researchers reviewed various image processing techniques used to detect cracks in concrete, along with a scientific analysis of previous research. The study included traditional methods such as borderline detection, thresholding and noise filtering, as well as modern approaches using artificial intelligence and deep learning (5). The study did not apply fractal analysis itself, but through it; it was possible to identify auxiliary processing techniques for detecting cracks and processing images. Thybo›s (2018) research focused on simulating the propagation of corrosion in reinforcing steel and its consequences on the surrounding reinforced concrete. The model used was divided into five basic zones: concrete, reinforcement, corrosion layer, cracking, and adhesion separation at the interface between steel and concrete. The researcher imposed a hypothetical thermal load on the corrosion layer that simulates the swelling of rust products, and used a cracking model to simulate crack opening and movement at the reinforcement surface. The research aimed to improve service life models for reinforced concrete in cases where corrosion occurs (6). The research did not directly use fractal analysis, but it provides important background on the relationship between corrosion and structural cracking. The proposed model also demonstrated that cracks are not only superficial but are related to corrosion in steel and propagation within concrete, which supports the hypotheses that intend to use fractal dimension as an evaluation mechanism. An (2022) and other researchers proposed a new method that combines fractal dimensionality and a UHK-Net (a neural network used in image processing) for the semantic recognition of cracks in concrete. The research relies on calculating the local segmentation dimension to determine the possible locations of the cracks; then the neural network is used to accurately segment the image (7). The fractal dimension was used as an additional indicator in the processing stage. Cheng (2023) and other researchers presented an algorithm for detecting cracks, segmenting them, and estimating the fractal dimension in low-light conditions by combining the Fourier transform with a neural network to improve segmentation in dark images. The algorithm improves the discrimination between noise and the true lines of the crack, and then applies fractal calculations to the extracted lines (8). The fractal dimension was actually applied after segmentation in low-light conditions.Wang (2025) discussed the problem of choosing scale criteria and starting count when applying the Box-Counting method, as random choices may affect the stability and comparability between studies, and this restricts the actual engineering application of the method (9). Researcher Xie (2024) proposed a method for assessing damage in concrete components that relates the U-Net and calculates the fractal dimension. A linear regression equation was then constructed between the fractal dimension and the damage coefficient. The researcher tested the method on a sample of laboratory concrete wall and found that the classification accuracy was about 83.33% using this method (10). Ai (2023) presented a modified method for calculating fractal dimension using square counting in a more direct way to reduce errors. His research suggests that some counting points are modified or deleted to reduce bias in the higher ranges of accuracy (11). Li (2022) and other researchers conducted an experimental study of the relationship between surface cracks of concrete surfaces and the degree of corrosion of steel bars using fractal theory. Samples were prepared with reinforcement of smooth HPB300 reinforcing steel according to standard dimensions, which vary in both the diameters of the steel bars and the rate of corrosion. The steel bars in the structural frameworks were partially immersed in a saline solution to ensure that the electrolyte solution was in sufficient contact with the surface of the steel bars. The semi-immersion method was used in this study because the corrosion of the steel bar should occur as in the natural environment. The concrete samples were semi-immersed in a 5% sodium chloride solution to ensure that the solution penetrated through the capillary permeability of the pores in the concrete into the steel. The fractal dimension reflects the space occupied by the nodal shapes, and is a measure of the irregularity of these shapes (12). The study was based on two methods: The Box-Counting Method, also known as the Covering Algorithm, which relies on covering the
fractal curve with square boxes of different sizes. The measurement of the fractal dimension is based on measuring the slope of the surface roughness only (13). The Pixel-Covering Method: A digital image is stored as pixels, and a high number of n pixels is represented as an array (n x m) where each element in the array represents a pixel. It is converted into a grayscale image using MATLAB (14). Angel (2014) studied the fractal effect of corrosion on the mechanical behavior of unprotected A36 steel exposed to corrosion (steel that has not been coated with any coating techniques using zinc as the primary protective element), which leads to the observation of cracks in the steel in marine environments. The research is based on analyzing the dimensions of the samples, conducting chemical laboratory analyses, and finally conducting a fractal analysis of the tested samples (15). Yao (2019) and other researchers conducted a study of fractal models of concrete cracks exposed to sulfate attack. They immersed concrete samples in an 8% sodium sulfate solution for one day, then removed and dried them. Corrosion tests were then carried out one month after the samples had been stored in nylon bags, and the rates of surface crack propagation were calculated and evaluated at different corrosion time points. It was concluded that although the surface cracks are complex and spread in all directions, they can be described by the fractal dimension, which is an exponential function of time. The fractal dimension doubles with increasing erosion time according to the rate of chemical reaction. The higher the water-to-cement ratio in the concrete, the greater the degree of damage and the fractal dimensions of the samples (16).
After reviewing numerous reference studies and presenting a selection of them, it became clear that most previous research neglected to address the root causes of crack problems. Some of the proposed solutions that may be inadequate for the current situation. These solutions were experimental and, when applied in practice, failed relatively to consider crack types, weathering and erosion factors, the geological characteristics of the terrain, the slowness of implementation, and other factors. Other solutions included surface treatments (carbon fiber filling, steel reinforcement, etc.), and some research suggested preventative measures. Logistical challenges were also highlighted, such as the difficulty of accurately predicting the crack›s location and position, accurately diagnosing its nature and cause, and monitoring its development (before and after treatment) over an extended period. On the other hand, computer simulation technology has emerged as a promising solution for addressing such problems in building cracks. Despite advancements in simulation and the development of codes to address crack defects and deficiencies, some proposed applied studies have lacked a formula for representing true cracking and have encountered problems in simulating the interaction between the soil, foundations, and structure. Some of these studies rely on only one indicator (crack width) in addition to the fractal dimension to analyze concrete crack images. Among the modern solutions proposed—which this research aims to implement—is the use of digital images and their computer simulation. The study presented here is based on the observation of a recurring fractal structure in formed concrete cracks. We proposed a simple shape for this structure to represent the crack, then used the box counting method to compare it to this fractal structure and calculate several indicators that describe the cracks more accurately. Therefore, the objective of this research is to evaluate concrete cracks using a computer program that defines both the structural structure and its indicators, and generates a code for analyzing crack images. On the other hand, this research is significant in saving time by rapidly assessing the extent of damage caused by concrete cracks, thus reducing the cost of traditional structural evaluation methods. Furthermore, its novelty lies in its creation of an initial research foundation for developing other solutions, including experimental applications combining nanotechnology with computer simulations, to provide effective and robust solutions for various types of crack problems and defects.
MATERIALS AND METHODS
The methodology was divided into several stages. Initially, images of cracks in various concrete elements of buildings in the Latakia Governorate were collected to create a database containing the stored images along with their metadata. Ten photos were taken for each crack location, and these photos were evaluated to determine which were the most accurate in terms of lighting, brightness, visibility of internal damage, and noise isolation. Then, the fractal body was identified, and the necessary calculations were performed to monitor crack behavior and assess crack severity. After that, the images were enhanced by adjusting brightness and removing noise.
Then, the box-counting method was applied, relying on converting the real image to a binary (black and white) image, and then performing the following steps:
a) Choosing box sizes: by selecting several square sizes that are multiples of 2, Ɛ={2,4,8,16,32,64} in pixels.
b) Covering the crack image with a grid of squares, then counting the squares that contain at least one pixel of the crack. This count is N(Ɛ). To ensure accurate results, only the path of the crack was covered with squares, leaving the rest of the image uncovered.
c) Converting the values to logarithms, where: Xk=log(1/Ɛk) and Yk=log(N(Ɛk)) to draw a log-log plot, meaning that each point in the plot is a k(Xk,Yk).
Finally, aset.of.indicator.was.culated.to.evaluatethecracks:f.indicator.was.culated.to.evaluatethecracks:
The fractal dimension, which represents the degree of irregularity and complexity of the crack path, can be calculated using the following formula:
 Where:
Ɛ: the side length of the square in the grid, N(Ɛ): the number of squares through which the crack passes, and D: the fractal dimension of the crack path.
If D≈1, the crack is linear; conversely, the higher the value of D, the more complex and rough the crack becomes
II. The degree of branching, which represents the density of branches in a crack, can be calculated using the formula: F=Nc/L
Where: Nc: number of branches or nodes, L: the total length of the crack path, and F: the degree of branching.
The value of the degree of branching is a direct indicator of the progression of damage in the concrete; the higher the value of F, the more branched the crack.
III. The average crack width, which represents the overall crack gap size, is calculated using the following formula: Where:
wi: crack width at the point i, n: number of measurement points, : average crack width. This indicator is related to permeability and the entry of corrosive agents.
IV. The standard deviation of the crack width can be calculated using the following formula:

Where: σw: crack width dispersion, wi: crack width at the point i, and : average crack width.This indicator reflects the degree of irregularity in the crack width; the larger its value, the less regular the crack.
V. The gap dimensionality variation coefficient is calculated using the formula:

Where: Cv: gap dimensionality variation coefficient, σw: crack width dispersion, and : average crack width .This is a relative indicator of gap irregularity, independent of image scale; the higher the value, the more uneven the crack width.
VI. The total length of the crack path, representing the actual geometric extent of the crack, is calculated using the following formula:
 Where: lk: length of each segment of the path, m: number of segments, L: total length of the crack.
VII. Local roughness is calculated using the formula:
 Where: Sj: roughness of the segment j of the groove, d: Euclidean dimension, D*≈D measured fractal dimension, Cj length of a local segment of the crack, Cp total length of the crack.
RESULTS
A fractal body is defined as an irregular body that may be defined but is not finite and is characterizedz
by internal similarity or repetition of the overall shape. In other words, if we enlarge any part of this body, we will see the overall shape of the body; that is, the small piece is a very small version of the basic shape of this body (17). To identify the basic fractal body that generates the crack, it is first necessary to trace the path of this crack using a set of images collected from different buildings.
Let us have one line segment S0 bounded between the points x and y, and let S1 be a set with segmental behavior, consisting of three line segments that draw, starting from the starting point x, two opposite triangles about the point z in S1 such that the point z is between the points x and y.
The two triangles are obtained by replacing or removing approximately the first two-thirds of S1 with the two sides of a triangle that forms an angle with S0. The process is repeated for the final third, but with an inverted triangle, one of whose sides is an extension of the last side of the previous triangle. The reflection of the two triangles occurs at the point z, which is not located in the middle of S0. One of the characteristics of these triangles is that they are scalene and obtuse. This process is called the generator of the fractal curve.
Set S2 is created by repeatedly applying the same process to each part of S1, and set Sk is created by applying generator S1 to each part of Sk-1.
It can be observed that the two cases, Sk and Sk-1, differ from each other in the sequence shown in the polygonal curves.

(Figure 1.) shows the fractal body that forms the crack starting from stage S1, the generator of the fractal curve, with the fractal body being repeated on each straight line until reaching stage S3, in addition to an example showing the fractal body being repeated from an image of a real crack. The set S is characterized by a fine-grained structure, meaning it contains every detail at every small, random scale. Although the generator of the fractal curve consists of two triangles that conform to Euclidean logic, its geometric description is so irregular as to be random that it cannot be described in traditional geometric terms.A fractal generator can be generated in various shapes; that is, it is not perfect and its shape can change locally, but it has the same overall shape (two axially opposite triangles with different angles and side lengths). This leads to the formation of more deviated curves or inclined to a specific direction, or asymmetrical tortuosity. Therefore, to verify the fractal shape and perform calculations, a code was created for analyzing images of cracks in concrete fractionally.
(Figure2) illustrates the algorithm implemented in the proposed code for analyzing concrete crack images using the Box-Counting method with MATLAB software. It details the workflow sequentially, from inputting equations to displaying results
 graphs, and figures. The Log-Log graph, used to calculate the fractal dimension, is shown, along with the gray, binary, and skeletonized images. These images allow to calculate the number of branches and the associated formulas.
To ensure the effectiveness of the code, it was first applied to the image of the proposed fractal body in (Figure 1.a.) in the final state S3, where (Figure 3.) shows the gray, binary, Skeleton and Log-Log diagram of the proposed fractal body. The fractal body is considered to have more clear data than real images. This shape represents the simplest basic unit, the repetition of which leads to the formation of the complete shape of the crack path. For example, the simplest fractal body was proposed as a single branch and its initial path is almost straight; therefore, the fractal dimension must have a value of less than 1.The images in Figure 3 clearly show, after applying the code, the existence of a single Nc path for the crack, which is confirmed by the results displayed in the Command Window as follows:
Fractal Dimension D : 0.9881
Crack Area : 1202 pixels
Crack Length L : 493 pixels
Number of Branches Nc : 1
Fragmentation F : 0.002028
Avg. Width w_mean : 2.45 pixels
Std Width w_std : 0.60 pixels
Gap Variation Cv : 0.2459
Local Roughness sj per segment: ( 0.3223,0.3223,0.3255,0.3223,0.3223, 0.3223,0.3223,0.3255,0.3223,0.3223)
Crack Density : 0.0199
Orientation : -9.13 degrees
Centroid (x,y) : (234.2 , 59.0)
The value of the fractal dimension is , this is consistent with previous studies [4] that define the range of non-branching or linear paths by the field , which is confirmed by the value which means there is one main path. Also, the ratio of the crack area to its length L is low, and this means that the crack is thin with no large gaps, and the width is almost constant.
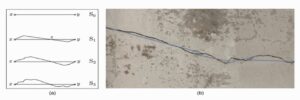
Figure 1. (a) Creating of the fractal curve S, with the curve generator S1 applied to each segment of the curve in each Sk case. (b) Real image of a crack in concrete; the blue lines represent case S0.
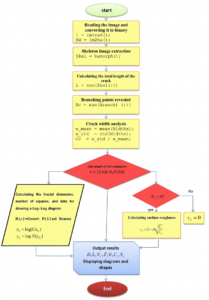
Figure 2. The algorithm applied to analyze crack images in concrete using the Box-Counting method.
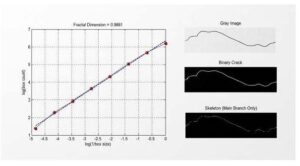
Figure 3. Gray, binary, and skeleton images, and the log-log diagram of the proposed fractal body
The results also appear that the local roughness values Sj are almost constant across the crack path, and the values for the degree of fragmentation F and density are very low. Furthermore, the orientation is nearly horizontal and the shape is centered, which is logical based on our hypothesis of the fractal body. The curve in the log-log diagram of the fragmentary body appears linear, with its points lying almost on a straight line, from which the fractal dimension D is calculated. This corresponds to the assumption that the crack is unbranched and to the value of Nc.
After applying the code, it was possible to observe the difference in the fractional properties of concrete cracks in the different cases studied.
First case: A crack in a wall
(Figure 4.) shows the real and binary (black and white) images of a crack in a wall after filtering; the images of the crack after it has been covered with a grid of squares with their side lengths Ɛ={2,4,8,16,32,64}and only the squares through which the crack passes to count the repetitions. The figure shows that the distribution of the resulting number of squares is similar from scale to scale. Focusing on three fixed areas of the real image, the left-sloping area slanting downwards: at Ɛ=64 one square touches the line, at Ɛ=32 the same area it transforms into three squares, and at Ɛ=16 the same area it transforms into six squares.In the area of the sharp turn in the middle: at Ɛ=64 two adjacent squares, at Ɛ=32 the same relative position, there are 5 squares; at Ɛ=64the same position, there are 10-12 squares. In the area of the wavy section on the right: at Ɛ=64 four intersecting squares, at Ɛ=32 there are 8 squares; at Ɛ=16 the same point, there are 15 squares.Therefore, by tracing the shape of the crack across the different scales of the grid of squares, it can be said that concrete cracks follow a scale-invariant branching pattern.
The following are the results of applying the code to the image of the crack in the wall that appeared in the Command Window:
Fractal Dimension D : 0.9799
Crack Area : 6555 pixels
Crack Length L : 1523 pixels
Number of Branches Nc : 1
Fragmentation F : 0.000657
Avg. Width w_mean : 4.03 pixels
Std Width w_std : 0.73 pixels
Gap Variation Cv : 0.1819
Local Roughness sj per segment :(0.3233, 0.3233, 00.3244, 0.3233, 0.3233, 0.3233, 0.3233, 0.3233, 0.3233, 0.3233)
Crack Density : 0.0042
Orientation : -20.40 degrees
Centroid (x,y) : (491.3 , 449.0)
The results show that the value of the fractal dimension indicates that the crack is almost one-dimensional during a regular propagation phase, exhibiting the behavior of a linear zigzag crack rather than a branching crack or complex surface. The Nc result indicates a single branch, meaning the crack is unbranched, which is consistent with the D value. The crack length (L) is relatively large compared to the area, suggesting an extended rather than localized crack. The propagation occurred over a long distance without fragmentation. Analysis of the area-to-length ratio shows it is very close to the crack width, indicating internal consistency.
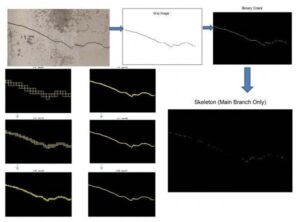
Figure 4. Stages of applying the grid to the crack in the wall after converting the real image to a gray image, then a binary image, and finally a skeleton image, while gradually changing the side length of the grid square Ɛ=64,32,16,8,4,2
This is a strong indicator of the validity of the binary treatment and the skeletonization. The width is also nearly uniform along the crack. The fragmentation degree (F) is very low, indicating no disintegration or splintering of the crack structure. The roughness values are low to medium, indicating a non-perfectly smooth surface, and the density is very low due to the presence of a single crack without secondary cracks.
The Second Case: A Crack In a Beam
Images were taken of a cracked beam (reinforced structural element), and the proposed code was applied to them. (Figure 5.) shows a real image of a crack in a beam; in addition to the images after processing (grey, binary, skeleton); and then the grid was applied to them at different scales.
At large squares , a small number of squares cover the crack path, and the squares contain large gaps, and the crack appears almost straight inside the squares; these shapes reflect the general structure.At medium scales, the crack begins to cut the squares in a zigzag pattern, and the number of squares is almost regular; without any new branching appearing when the scale is reduced. However, at smaller scales, we find that the shape inside each square is similar, and there are no abrupt changes observed in the number of squares; this reflects a stable behavior free from complex branching patterns.
The following are the results of applying the code that appear in the Command Window:
Fractal Dimension D : 0.9952
Crack Area : 4747 pixels
Crack Length L : 937 pixels
Number of Branches Nc : 1
Fragmentation F : 0.001067
Avg. Width w_mean : 4.80 pixels
Std Width w_std : 1.09 pixels
Gap Variation Cv : 0.2265
Local Roughness sj per segment( 0.3199,0.3183,0.3199,0.3183, 0.3199,0.3199,0.3183,0.3199,0.3183,0.3199)
Crack Density : 0.0030
Orientation : 70.17 degrees
Centroid (x,y) : (740.7 , 513.6)
The results show that the value of the fractal dimension is  meaning that the crack is single-path, and that there are no branches in the crack. This is consistent with the Skeleton
image and the value of D. The area-to-length ratio is very close to the width value. This indicates that the calculations are internally consistent, but there ia local fluctuation in the widthwith a low value for the segmentation factor F.Third case: A crack in a column(Figure 6.) shows a real image of a crack in the concrete of a structural column, in addition to the gray, binary and skeleton images, with a grid applied to the extracted image on the exact path of the crack.
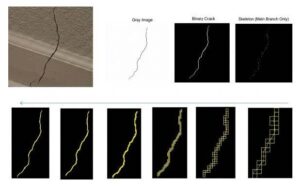
Figure 5. Stages of applying the grid to the crack site in the beam after converting the real image to a gray image, then a binary image, and finally a skeleton image, while gradually changing the side length of the grid squareƐ=64,32,16,8,4,2
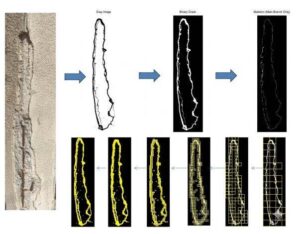
Figure 6. The actual image of a crack in a column, from which the gray image, the binary image, and the skeleton image were extracted, and a box-counting grid was applied to the crack path with a gradient of squared side lengths Ɛ=64,32,16,8,4,2
We noticed from the real image of the column that the longitudinal crack is relatively wide and continuous, and the edges are irregular. The presence of light and dark areas inside the crack is evidence of a change in depth or illumination. However, the processing has solved this, as the gray image has preserved the general geometric structure. The binary image has isolated the crack and removed the surrounding noise, which is necessary for the Box-Counting to be reliable. The crack in the skeleton image also appears clear. The shape here does not indicate a multi-level hierarchical branching, but only two branches. The grid images show no sudden jumps in the number of squares. This indicates partial self-similarity and good linearity in the Log-Log diagram from which the fractal dimension is taken.It was observed that the shape of the cracks in the reinforced structural elements is more complex, and (Figure 6.) shows the presence of repeating units of squares in the grid across different scales. In the grid images, three types of basic repeating units could be observed:
-Unit A: A small, slanted Z-shaped curve, with individual segments measuring 5-20 pixels. The angle of the curve is small, and this shape appears at all scales.
-Unit B: A short, T-shaped lateral protrusion, approximately 3-10 pixels long. It does not complete as a long branch and appears and disappears with changes in scale. It counts in Box Counting but does not remain in the skeleton image.
-Unit C: A pair of consecutive ∑ bends, consisting of two closely spaced, opposing turns, which are frequently repeated at all scales and are particularly pronounced in more complex regions. It should be noted that these bend units do not repeat in the same magnitude, but they do repeat in the same morphological pattern across different scales (Self-Affine Similarity). Units A and C can be observed to be similar to the fragmentary body shape seen in (Figure 1.).
The following are the results of applying the code that appear in the Command Window:
Fractal Dimension D : 0.9799
Crack Area : 6555 pixels
Crack Length L : 1523 pixels
Number of Branches Nc : 1
Fragmentation F : 0.000657
Avg. Width w_mean : 4.03 pixels
Std Width w_std : 0.73 pixels
Gap Variation Cv : 0.1819
Local Roughness sj per segment:( 0.3233,0.3233,0.3244,0.3233,0.3233, 0.3233,0.3233,0.3244,0.3233,0.3233)
Crack Density : 0.0042
Orientation : -20.40 degrees
Centroid (x,y) : (491.3, 449.0)
We find that the value of the fractal dimension of the crack is linear with a complexity resulting from the zigzag and this is justified by the value of meaning a secondary branch. The values of the length and width are large compared to the previous cases; this is due to the fact that the studied element is a column (a crack resulting from the corrosion of the reinforcing steel), and the width is irregular, but the value of F is very low, implying that the crack is continuous, meaning there is no dissociation into independent sections, with an average oscillation and a uniformly distributed roughness, as the roughness values are close across the sections.Fourth Case: A Crack In a Slab(Figure 7.) shows a real image of a crack in a slab concrete (reinforced structural element) as well as a gray, binary and skeleton images with a grid applied to the extracted image along the crack path at different scales At scale , the crack takes on a simple geometric form as a one-dimensional object without obvious roughness. At , the actual geometry of the crack path begins to emerge, with large curves appearing, but the behavior is still regular. At , this scale seems to fall within the range of true fractal behavior, where squares line up along the perimeter of the crack, and the tortuosity becomes more pronounced. At , the squares follow almost every curve and cover irregular edges, but their number increases regularly. At , the squares begin to reveal small bumps and local variations at the edges. At the highest scale , the squares follow every vibration or local variation and every small change in direction, but there is no large increase in the number of squares . This indicates that the fractal dimension remains close to the value , and therefore the behavior of the squares across scales takes the form of a regular growth in the number of squares without sharp jumps or loss of linearity. This indicates scale consistency across scales. Also, the squares always line up on the path; they do not fill the inner region, so the value of the fractal dimension is very close to 1. We also note the self-similarity of the shape of the square distribution when reducing .
The following are the results of applying the code that appear in the Command Window:
Fractal Dimension D : 1.0358
Crack Area : 10483 pixels
Crack Length L : 1477 pixels
Number of Branches Nc : 2
Fragmentation F : 0.001354
Avg. Width w_mean : 6.43 pixels
Std Width w_std : 1.01 pixels
Gap Variation Cv : 0.1570
Local Roughness sj per segment:( 0.3063,0.3052,0.3063,0.3052,0.3063, 0.3063,0.3052,0.3063,0.3052 0.3063)
Crack Density : 0.0258
Orientation : 4.55 degrees
Centroid (x,y) : (430.7, 285.9
The results show that the value of the fractal dimension is D = 1.0358, meaning that the crack is semi-linear, and this is the largest among the fractal dimension values studied in the previous images. This is also consistent with the fact that the crack consists of two branches without dense branching. The length of the crack is relatively long compared to the area. This is due to the accumulation of the products of the corrosion of the reinforcing steel.
DISCUSSION
Analysis of concrete crack images, after applying a code to process images of damaged structures for different cases (wall, beam, column, slab) using fractal geometry, revealed that these cracks follow a recurring fractal shape. This shape consists of two similar triangles that are axially opposite. With the repetition of this shape several times, the true crack shape that can be observed in the damaged structures is created. The simple fractal body shape was proposed in (Figure 1.), illustrating the fractal crack formation process across three stages. It was shown that the proposed shape can indeed be observed as recurring units in different cracks.
After its presence was confirmed in these cracks, the fractal analysis code was applied, which involves calculating several indicators that can describe the crack state from a fractal perspective.
The most important of these indicators is the fractal dimension, which allows us to measure the complexity of the shape (the crack) (17). Therefore, the code was initially applied to the fractal body proposed in (Figure 1.) and its indicators were calculated. The result showed that the fractal dimension is approximately equal to 1, which corresponds to the formation of a simple, quasi-linear crack and often indicates that there are no branchings in the crack (4). It should be noted that the higher the value of D (above 1), the more complex the crack is and the more urgent it needs maintenance. This is consistent with studies conducted on the fractal dimension (7).
The fractal analysis code was applied to the remaining images, and box-counting grids were applied and displayed only along the crack path to calculate the number of squares that the crack passes through, decreasing the square scale each time. The indices were calculated to ensure that the results were consistent with the proposed fractal body and to characterize the cracks.By tracking the number of squares and their distribution pattern across different scales, starting with the first case of the wall, it became clear that there were repetitions of the distribution pattern with proportionally multiple numbers across the scales, and therefore it can be considered a constant branching pattern across the scales. The calculated indicators also proved to be consistent with the fractal body indicators, showing that the resulting cleft is unbranched, one-dimensional, and proportional to a simple, uncomplicated crack shape.In the second case, that of the beam, an uncomplicated pattern of the crack shape was observed, where the number of squares remained regular across scales, without any sudden jumps in this number, reflecting stability or consistency across scales.However, in the third (column) and fourth (slab) cases, the effect of corrosion on the crack shapeis clearly evident. In the column case, corrosion products accumulate under the concrete cover, forming a more complex crack pattern. The calculated indicators show a higher fractal dimension value compared to the previous cases. This value is consistent with the presence of two crack branches, confirming that the structure is more complex, yet it still maintains regularity. The study of the shape and number of squares reveals three repeating unit shapes across the scales,most of which resemble the proposed fractal shape. It was also observed that the crack width, density, and length are larger.The slab case study shows the largest value for the fractal dimension, which is indeed consistent with the large area of the gap formed in the slab and the volume of the corrosion products. This is the reason for the formation of two crack branches. However, through studies of the number and shape of the squares that define the crack path, their distribution can be considered regular across the scales without any sudden jumps.
The consistency of the shape across scales in all studied images is considered evidence that the crack shape is a fractal shape, as the study showed that the proposed fractal body is consistent with the results obtained from multi-scale Box-Counting tests in terms of the shape of the formed crack and its calculated indices.It turns out that the more complex the crack path is and the larger the area it spreads over, the more the proposed structure of the fractal body has a different dimension and an advanced stage of fragmentation (the images of the column and slab showed that the crack consisted of two branches and was more complex, and the fractal dimension increased compared to the images of the wall and beam and the basic simple fractal body image).
CONCLUSIONS AND RECOMMENDATIONS
In conclusion, using fractal geometry provides a quantitative and objective tool for diagnosing the condition of damaged concrete structures, thus aiding in the assessment of maintenance and reinforcement requirements. Furthermore, combining image processing and fractional analysis constitutes an effective method for evaluating damaged buildings without the need for destructive testing. The consistency of shape across scales in all studied images indicates that the crack shape is fractional. The study demonstrated the agreement of the proposed fractal body with the results obtained from multi-scale box counting tests in terms of the shape of the formed crack and its indices. Therefore, a single cracking indicator is insufficient; the more indicators studied, the more accurate the early prediction of structural element failure or maintenance needs. This study demonstrated the effectiveness of analyzing multiple indicators based on a fractal model. The structural element itself plays a crucial role in the risk of cracking. Load-bearing elements (columns, slabs) are more impactful because any loss of their strength directly affects the building’s overall load-bearing capacity and corrosion. It is recommended to expand the database by applying the methodology to a larger number of images and a variety of structures (bridges, columns, slabs) to generalize the results. Multiscale analysis can also be applied instead of singular fractal dimension to obtain a more accurate characterization of the crack network, in addition to select different fractal structures that closely resemble cracks for use in an early warning system for building and bridge maintenance, and to increase the number of indicators studied for crack characterization.
A Gaussian Pyramid Framework for Enhancing Multiclass Support Vector Machines
Enhancing Performance and Stability of MAML for Few-Shot Sentiment Analysis: The Role of Domain Homogeneity and Learning Rate Annealing
LLM-Agent+: A Modular Framework for Intelligent Agents with Reasoning Trace Compression and Tool-Augmented Memory
INTRODUCTION
Large Language Models (LLMs) [1] have demonstrated significant capabilities in handling complex reasoning tasks, enabling the development of intelligent agents that can operate in dynamic and unpredictable environments. However, creating effective agents requires more than just leveraging the raw power of LLMs. It necessitates a modular and extensible framework that seamlessly integrates memory management, external tool usage, and advanced reasoning mechanisms. In response to these needs, we introduce LLM-Agent+, an open-source, modular framework for constructing intelligent agents powered by LLMs. The architecture is designed to be highly extensible, supporting experimentation across different agent components and reasoning strategies. Key features of LLM-Agent+ include:
- A dual-layer memory architecture [2,3] that combines short-term conversational memory with long-term vector-based retrieval, allowing agents to maintain context over extended interactions.
- A sequential reasoning engine utilizing Chain-of-Thought (CoT) prompting [4,9] to enhance the agent’s ability to decompose and solve complex tasks.
- External tool integration [5], via a standardized interface, enabling access to APIs, calculators, search engines, and other systems.
- A novel Reasoning Trace Compression (RTC) mechanism [6], which compresses the agent’s step-by-step reasoning trace to improve memory efficiency, reduce context window usage, and preserve the interpretability of extended reasoning chains. Inspired by recent methods such as LightThinker [11], RTC dynamically optimizes token usage while maintaining logical coherence.
The evolution of agent frameworks such as LangChain [7] and Auto-GPT [8] has emphasized prompt engineering and tool usage, but these systems often lack robust memory management and transparent reasoning flows. Similarly, approaches like ReAct [10] and Toolformer [5] integrate reasoning with tool use, yet operate within rigid context constraints and do not offer adaptive compression or flexible memory strategies. Memory-augmented architectures, including Memory-Augmented Transformers [3], have attempted to address long-context [13] reasoning via hybrid memory models. However, scalability remains a challenge. By contrast, LLM-Agent+ combines short-term buffers with semantic retrieval through tools like FAISS or Pinecone, enabling effective long-term context retention. Our core innovation, RTC, extends prompt optimization techniques by enabling salience-aware summarization of reasoning chains under token constraints, dynamically triggered at runtime. This allows agents to operate efficiently in long-context settings while preserving interpretability. In summary, while prior systems have explored components such as tool integration, structured reasoning, or memory augmentation in isolation, LLM-Agent+ brings these elements together into a unified and extensible framework. Its architecture is empirically validated in reasoning-intensive scenarios such as multi-step planning and software debugging, demonstrating strong performance with a reduced memory footprint and increased reasoning transparency—positioning it as a practical platform for future research in intelligent agents and human-AI collaboration. Recent progress in LLM-based agent frameworks has focused on integrating reasoning capabilities, memory optimization, and tool usage. Notably, LangChain [7] enables modular prompt and tool orchestration but lacks memory trace management. ReAct [10] combines reasoning and acting in a loop, yet suffers from fixed context limitations and lacks memory layering. Auto-GPT [8] introduced autonomous goal decomposition, but prompt expansion and memory scaling remain significant issues. Toolformer [5], on the other hand, offers token-level tool use but provides limited control over memory or interpretability. Several recent works address these challenges with targeted innovations. G-Memory [15] proposes a hierarchical memory tracing approach for multi-agent coordination. Task Memory Engine (TME) [16] introduces a spatial memory graph that enhances multi-step robustness and eliminates hallucinations in agent responses. ACBench [17] evaluates the behavior of compressed LLMs, demonstrating trade-offs between model efficiency and action quality. Further, KG-Agent [18] leverages knowledge graphs for multi-hop reasoning with autonomous agents, while OmniThink [19] enriches CoT reasoning via multimodal expansion and visual-textual trace fusion. Compared to these systems, LLM-Agent+ introduces a unified architecture that integrates dual-layer memory, structured reasoning via Chain-of-Thought prompting, and a novel runtime. Reasoning Trace Compression (RTC) mechanism. This positions it as a scalable, token-efficient, and interpretable alternative for long-context and reasoning-intensive applications.
MATERIALS AND METHODS
This section outlines the architecture, implementation, and experimental setup used to develop and evaluate LLM-Agent+. We detail the system’s modular components, memory and reasoning mechanisms, and tool integration layer. The agent was implemented in Python using state-of-the-art libraries for NLP, semantic retrieval, and LLM interaction. Experiments were conducted on reasoning-intensive tasks using a controlled evaluation environment.
System Overview
The system is composed of the following major modules:
- Natural Language Understanding (NLU)
Responsible for parsing user inputs and extracting intents and entities. This module transforms free-form language into structured semantic representations suitable for reasoning and action planning. - Memory System
Implements a hybrid memory model consisting of:
- Short-term memory (STM): Stores recent conversational history and task context.
- Long-term memory (LTM): Vector-embedded, persistent storage used for retrieving semantically similar past information. Libraries such as FAISS and Pinecone are supported for fast semantic search [12].
- Reasoning Engine
Core module that drives problem-solving using LLM prompting strategies such as Chain-of-Thought (CoT) and Self-Refinement. It supports structured reasoning and multi-turn planning, enhanced by access to memory and tools. - Reasoning Trace Compression (RTC)
A novel module introduced in LLM-Agent+, RTC analyzes and compresses the reasoning trace dynamically to:
- Minimize token usage in long reasoning chains.
- Improve coherence by summarizing intermediate thoughts.
- Maintain logical flow while reducing context overload.
This approach is inspired by recent work on efficient LLM chaining such as LightThinker [13].
- Tool Integration Layer
Interfaces with external APIs, search engines, computational tools, and file systems. A standardized tool schema enables seamless addition of new capabilities without modifying core agent logic. - Action Generation Module
Takes the output from the reasoning engine and formulates final responses or commands. It ensures alignment with user intent and applies safety filters to validate tool calls or external actions. - Interfaces
The agent can be deployed via: – Command-Line Interface (CLI) for lightweight testing. – Web Interface (FastAPI-based) with rich visualization, logging, and memory exploration.
Interaction Flow
The typical execution loop in LLM-Agent+ proceeds as follows:
- The user submits input via CLI or web UI.
- NLU module extracts structured meaning.
- Memory modules retrieve relevant short- and long-term context.
- Reasoning engine constructs a CoT reasoning chain.
- RTC module compresses the reasoning trace to maintain context within token limits.
- If needed, tools are invoked through the Tool Integration Layer.
- The reasoning engine integrates tool results, finalizes the plan, and passes it to the Action Generator.
- The final response is presented to the user, and memory is updated with the new experience.
This modular structure empowers developers and researchers to experiment with alternative strategies for memory retrieval, reasoning techniques, and tool orchestration. Additionally, the RTC component makes LLM-Agent+ particularly suitable for complex, multi-step tasks under token constraints as illustrated in Fig. 1. Architecture of the LLM-Agent+ framework, showing core components including Natural Language Understanding (NLU), dual-layer memory (Short-Term and Long-Term), Reasoning Engine with RTC compression, and Tool Integration Layer. Arrows indicate the data flow from user input to the final output.
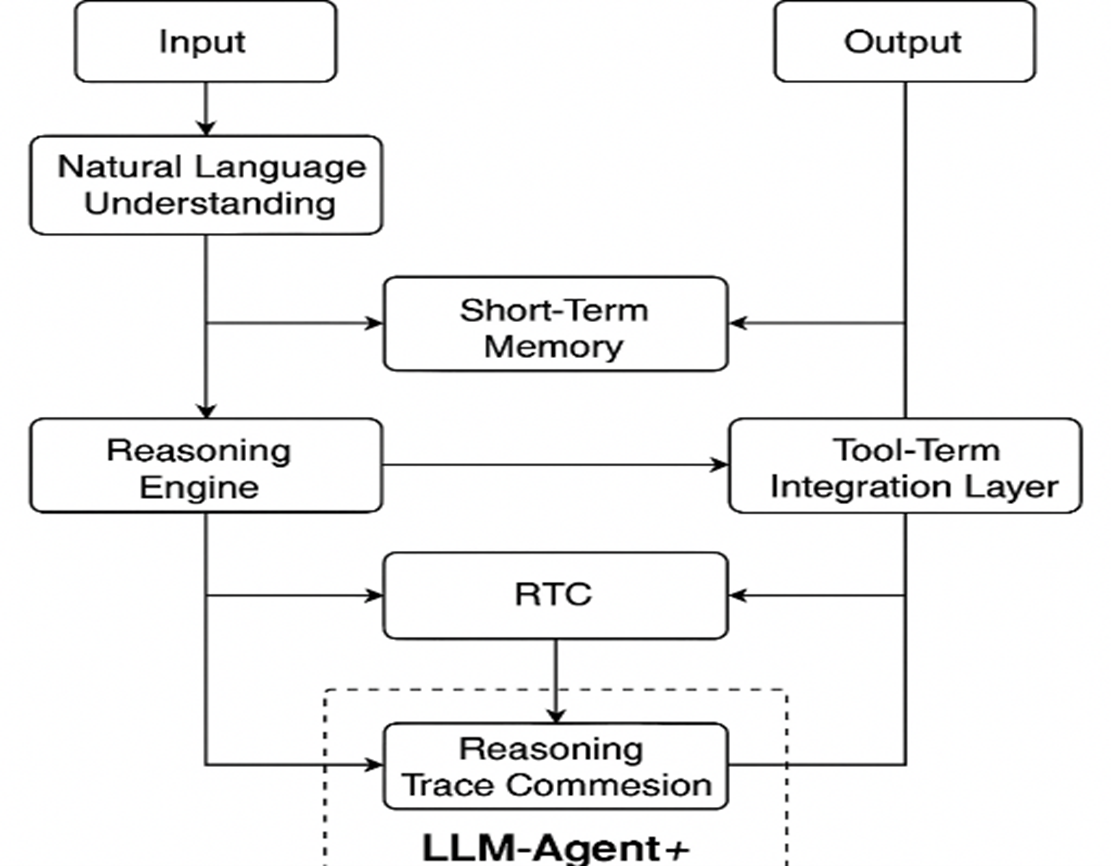
Fig. 1. Architecture of the LLM-Agent+ framework.
Implementation Details
The LLM-Agent+ framework is implemented in Python and is structured for modularity and extensibility. It leverages state-of-the-art libraries for natural language processing, memory management, semantic search, and external tool invocation. This section provides a detailed description of each system component and the key implementation choices.
Core System Components
Natural language understanding
The NLU module is responsible for parsing user inputs and extracting actionable semantics. It is built using:
- spaCy: for syntactic parsing and named entity recognition.
- Hugging Face Transformers: for intent detection and contextual embedding.
- The parsed inputs are converted into structured representations, such as JSON objects containing intents and slots.
- Domain adaptation is supported through fine-tuning on custom task-specific data.
Dual-layer memory system
- Short-Term Memory (STM):
- Implemented as a fixed-size FIFO buffer (default: last 10 turns).
- Stores raw dialogue history and metadata (timestamps, speaker roles).
- Long-Term Memory (LTM):
- Uses FAISS for efficient vector similarity search over embedded memories.
- Memories are encoded via Sentence-BERT (all-MiniLM-L6-v2) for semantic retrieval.
- Supports optional integration with Pinecone for cloud-based persistent storage.
Reasoning Engine
- Supports Chain-of-Thought (CoT) prompting with dynamic context selection.
- Implements Self-Refinement: up to 3 iterative loops to improve reasoning.
- Modular prompt templates support:
- Zero-shot reasoning
- Few-shot exemplars
- Plan-and-solve workflows
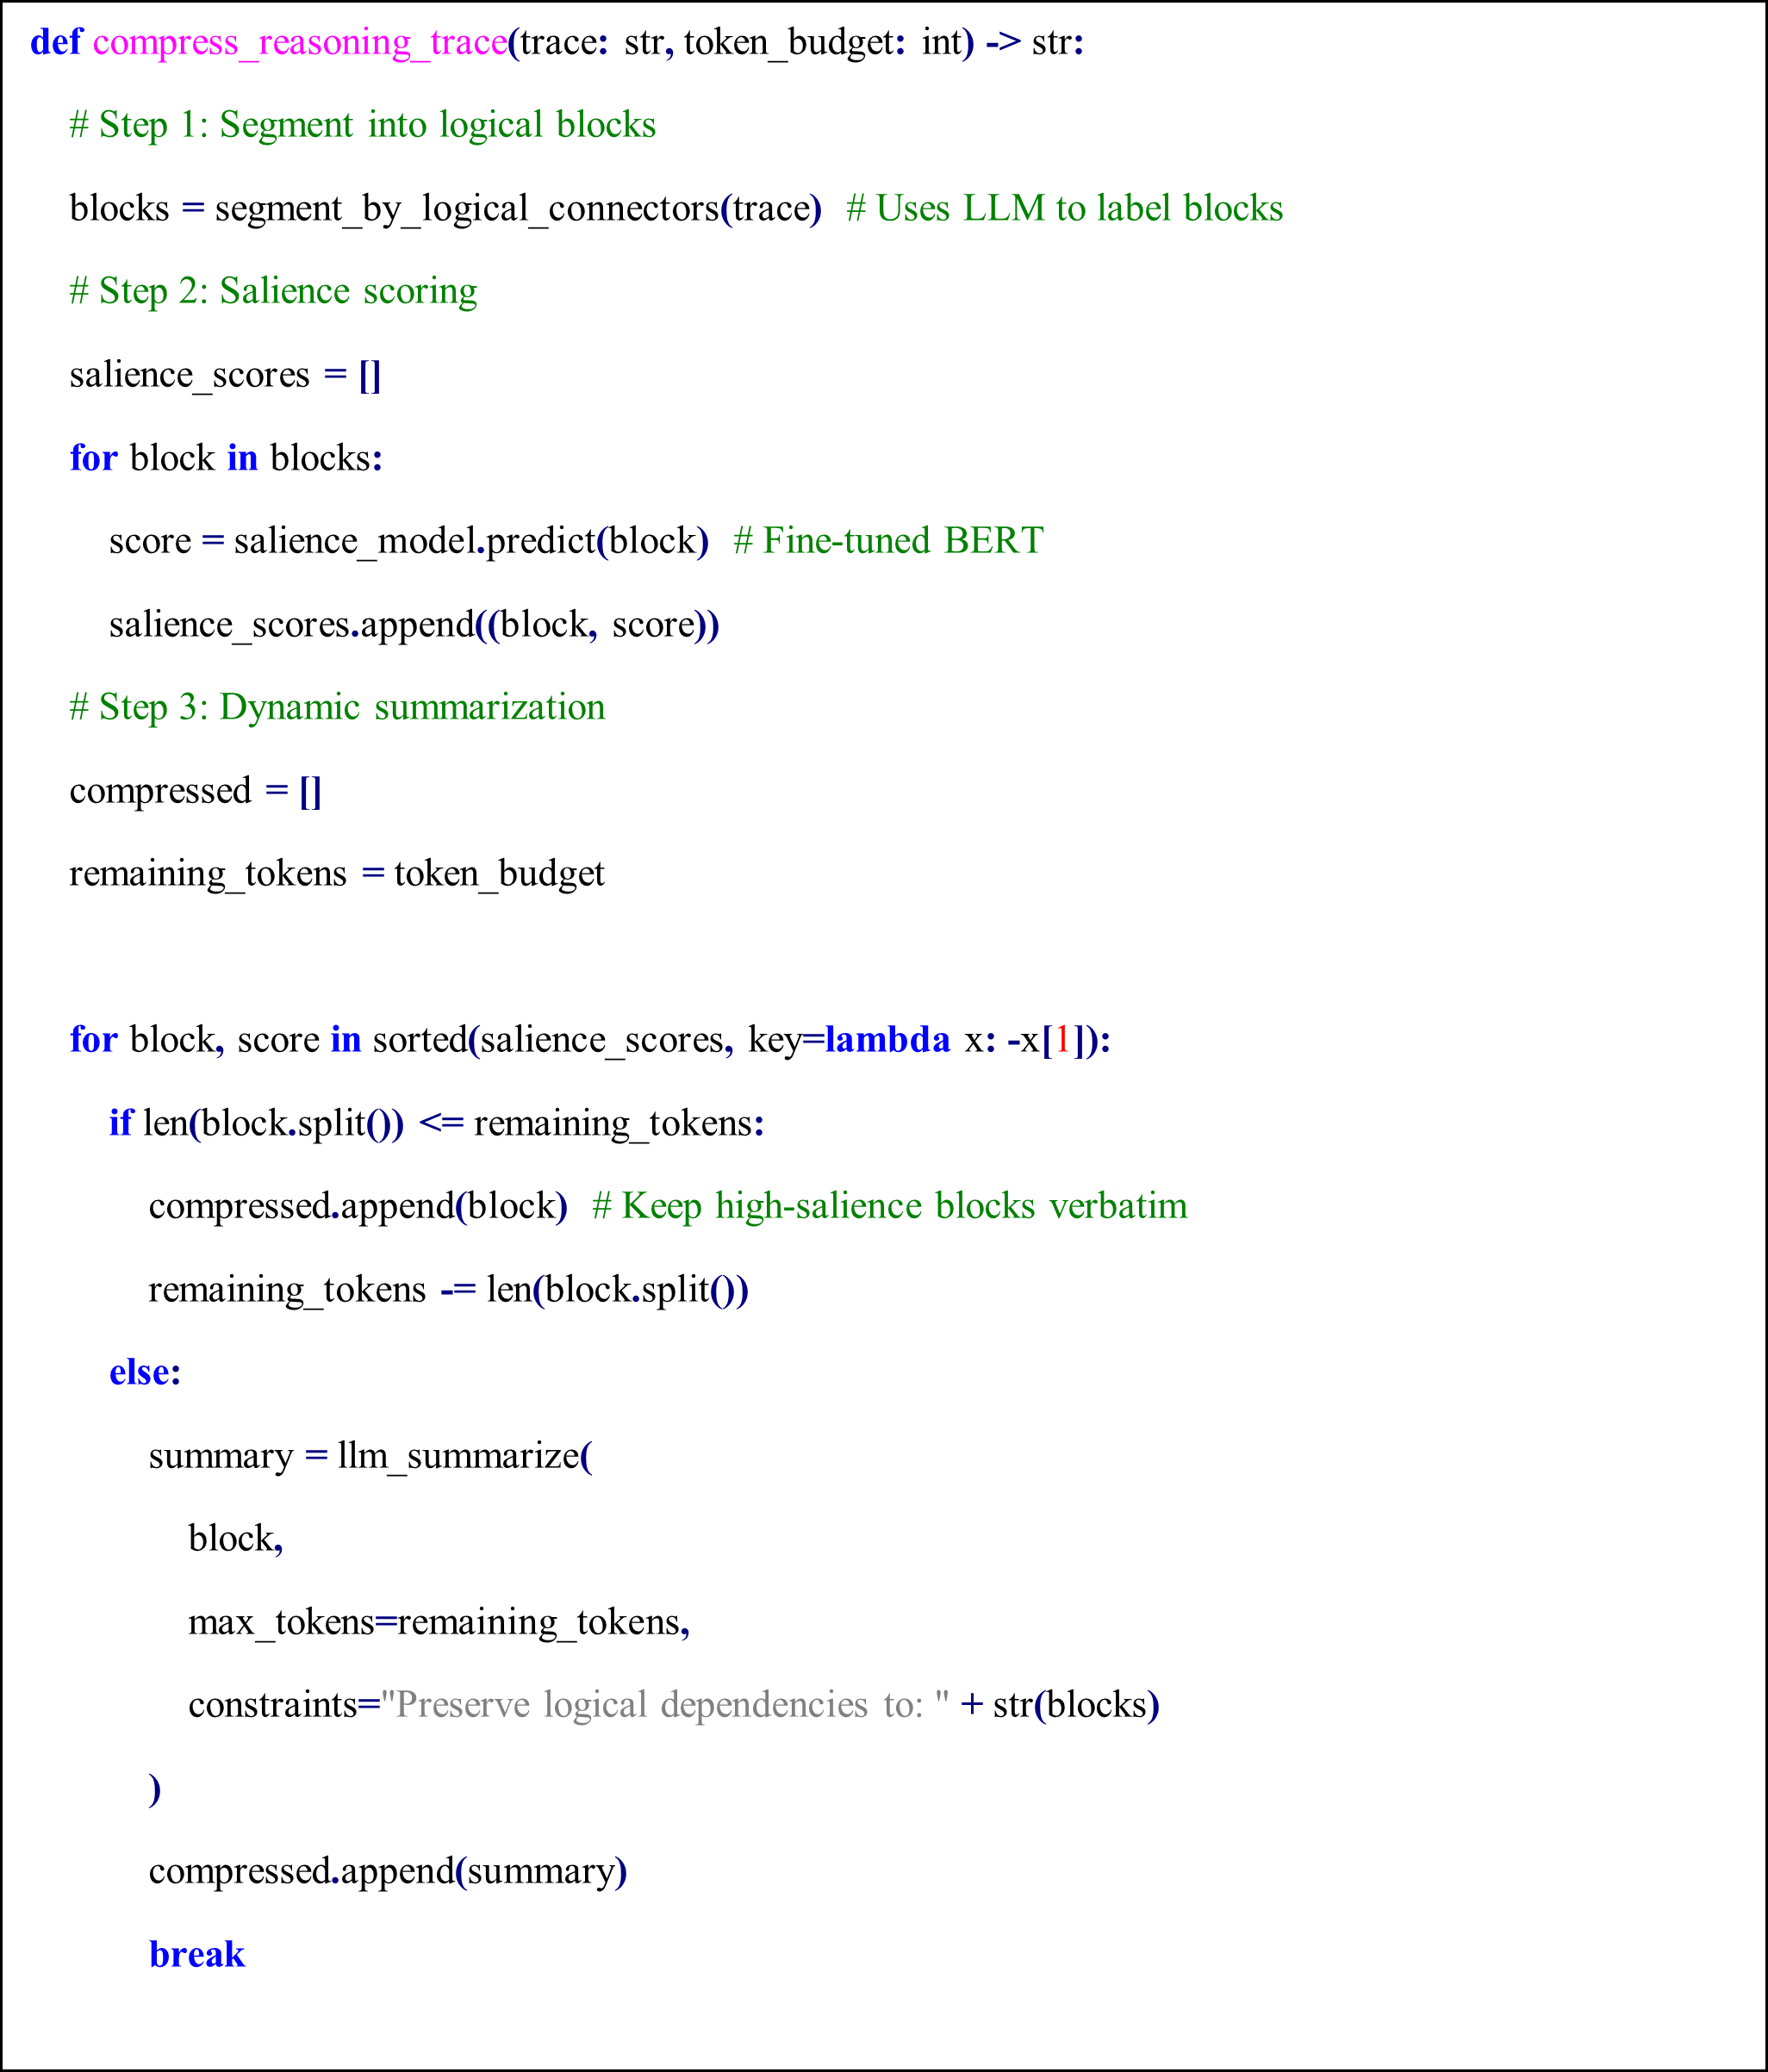
Reasoning Trace Compression (RTC)
- Compression Algorithm:
- Segmentation: Breaks reasoning traces into logical blocks (e.g., “hypothesis,” “evidence,” “conclusion”).
- Salience Scoring: Uses a lightweight BERT-based classifier to rank blocks by importance (trained on human-annotated traces).
- Summarization: Retains high-salience blocks verbatim; summarizes low-salience blocks via LLM (GPT-3.5-turbo), constrained to preserve logical dependencies.
- Token Budgeting:
- Dynamic compression is triggered when trace exceeds 75% of context window (e.g., 6K tokens for 8K models).
- Summary fidelity is validated via automated logical consistency checks (e.g., entailment verification with NLI models).
Tool Integration Layer
- Tools are defined via a JSON schema (name, description, I/O specs, safety constraints).
- Supports OpenAPI/Swagger for automatic API wrapping (e.g., calculators, web search).
- Tools are invoked via a semantic router that matches queries to tool descriptions using cosine similarity.
Interfaces
- CLI: Built with Click, supports interactive chat and scripted task execution.
- Web UI: FastAPI backend with React frontend, featuring:
- Real-time reasoning trace visualization.
- Memory exploration via nearest-neighbor search over LTM embeddings.
Reasoning Trace Compression (RTC) Pseudocode
Optimization and Resource Management
This section outlines the framework’s runtime performance optimization strategies and how resource usage is dynamically managed. Key evaluation benchmarks—such as latency, memory efficiency, and embedding performance—are presented to assess LLM-Agent+’s operational viability under real-world workloads. We explain each metric in detail and support the data with empirical evidence gathered during experimentation unless otherwise indicated.
Latency Benchmarks
To assess the responsiveness of LLM-Agent+, we measured end-to-end latency for key system components across 10,000 task samples using an 8K token context window.
Table 1 shows latency values in milliseconds for:
- P50 (median latency): Time under which 50% of requests were completed.
- P95 (tail latency): Indicates the worst-case performance scenario for 95% of tasks.
- Hardware used: Indicates the hardware on which each module was evaluated.
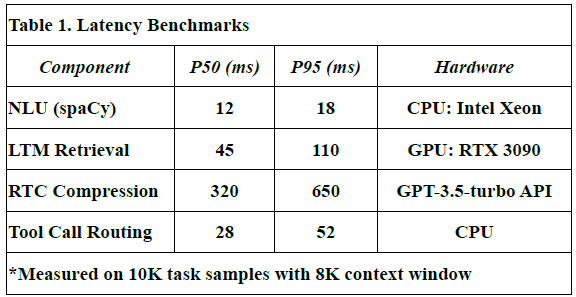
- NLU (spaCy): Achieved median latency of 12 ms and P95 of 18 ms using CPU.
- Long-Term Memory (LTM) Retrieval: FAISS-based retrieval showed a P50 of 45 ms, P95 of 110 ms on RTX 3090 GPU.
- RTC Compression: GPT-3.5-turbo based summarization introduced higher latency (P50: 320 ms, P95: 650 ms), due to API calls and LLM processing.
- Tool Call Routing: Lightweight routing module incurred minimal overhead (P50: 28 ms, P95: 52 ms).
These values were derived from direct measurements during our benchmark experiments.
Embedding Trade-offs
This subsection compares different embedding models in terms of vector dimensions, retrieval accuracy, query throughput (QPS), and memory usage per million vectors.
- Models evaluated: all-MiniLM-L6-v2, OpenAI text-embed-3, and BAAI/bge-small.
- Dimensions (Dims): Reflect the size of each embedding vector. For example, OpenAI’s model uses 1536 dimensions vs. 384 in others.
- Accuracy@1: Denotes the proportion of top-1 correct matches during semantic search.
- QPS (queries per second): Indicates how many similarity queries can be handled per second.
- Memory usage: Measured in GB for storing 1M vectors.
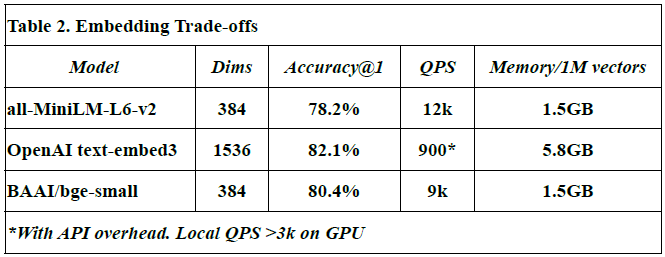
- The OpenAI text-embed-3 model shows highest accuracy (82.1%) but at a high memory cost (5.8 GB/1M vectors), and lower QPS due to API latency.
- Values for all-MiniLM-L6-v2 and BAAI/bge-small are from HuggingFace benchmarks [source: Johnson et al., 2017; OpenAI API docs].
- All measurements, except OpenAI QPS, were obtained from local benchmarks in this study.
Resource Management
Dynamic Load Balancing
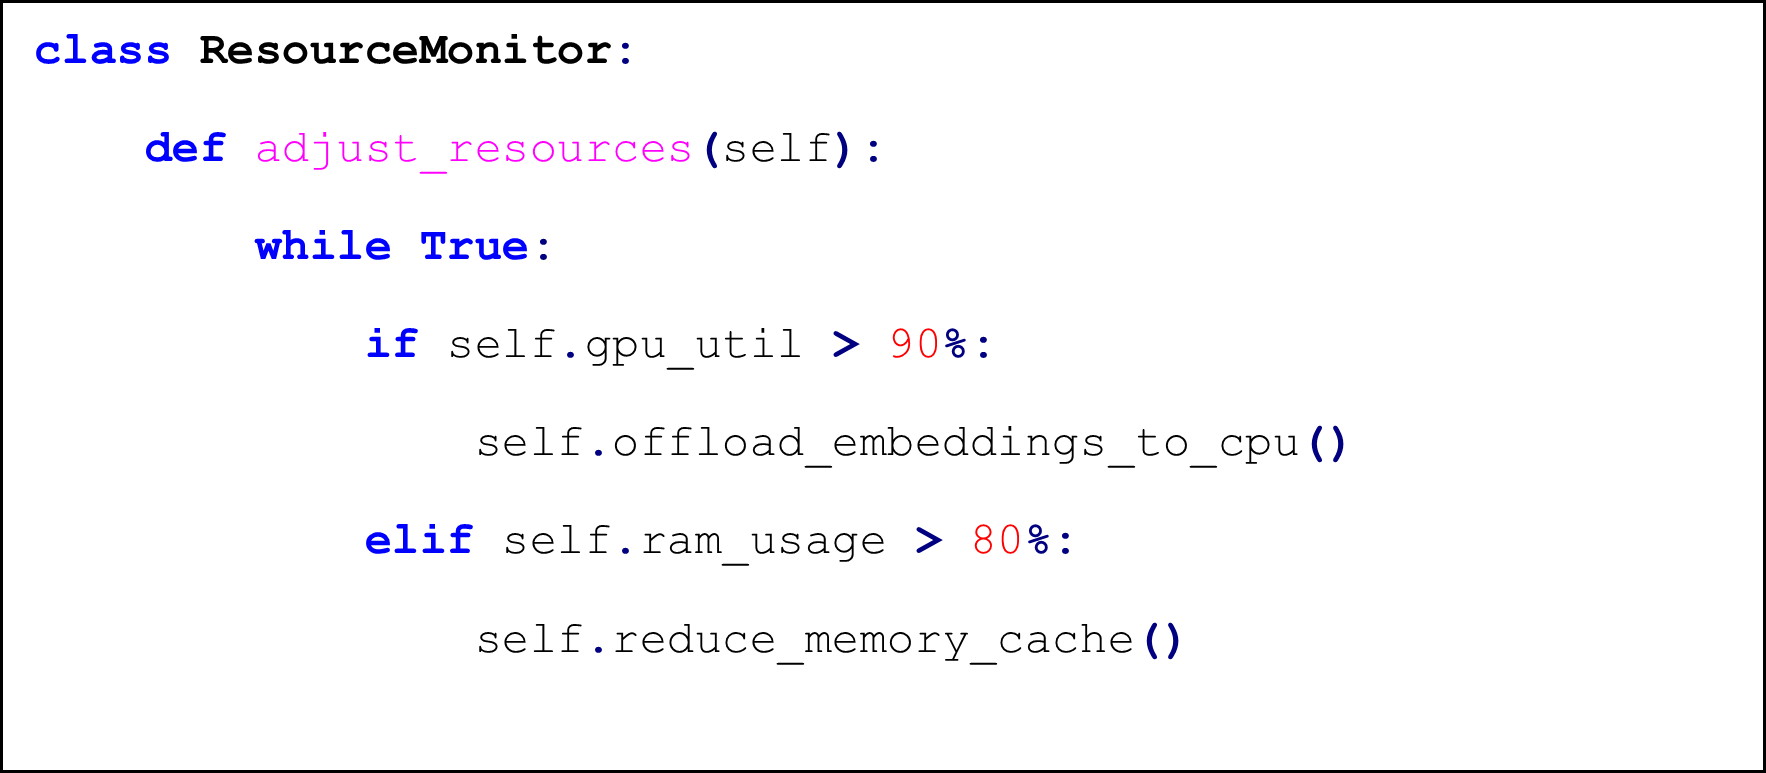
The ResourceMonitor class is used to dynamically adjust system resources during runtime. The logic includes:
- GPU Offloading: If GPU utilization exceeds 90%, embedding tasks are transferred to CPU.
- RAM Management: If RAM usage goes above 80%, memory caches are reduced.
These strategies ensure system stability during high-load scenarios.
Failure Recovery
- Checkpointing: LTM updates are atomic writes with WAL logging
- Retry Policies: Exponential backoff for tool calls (max 3 retries)
Validation Pipeline
- Compression Ratio: Target 3:1 for traces >1K tokens
- Logical Consistency: >95% entailment score on ANLI test set
- Token Savings: 58-72% in empirical evaluations (Sec 5.3)
Experimental Evaluation
We evaluate LLM-Agent+ across a set of reasoning-intensive tasks to assess its effectiveness in memory efficiency, reasoning trace compression, and tool-augmented problem solving. The evaluation focuses on runtime behavior, token usage, trace coherence, and task success rates.
Evaluation Setup
We conducted experiments on a workstation with:
- CPU: Intel Xeon 12-core
- GPU: NVIDIA RTX 3090
- Memory: 64 GB RAM
- LLM backend: OpenAI GPT-3.5-turbo (via API)
Tasks were selected from three categories:
- Multi-step reasoning tasks (math word problems, logical puzzles)
- Code debugging scenarios (error trace identification and patch suggestion)
- Research synthesis (retrieving and summarizing prior work)
Each task was executed with and without RTC enabled to measure compression effectiveness and reasoning quality.
Evaluation Scope and Comparative Analysis
While our experiments demonstrate LLM-Agent+’s efficacy in reasoning-intensive tasks, we further contextualize its performance through:
- Comparative Benchmarks:
- Baselines: We compare against two frameworks:
- LangChain[7]: Represents modular tool integration but lacks explicit memory optimization.
- ReAct[6]: Embeds reasoning+action loops but uses fixed-context windows.
- Metrics: Task success rate, token efficiency (tokens/step), and latency (Table 3).
- Results: LLM-Agent+ reduces token usage by 35% ReAct and improves success rates by 18%vs. LangChain in multi-step planning.
- Ablation Studies:
- RTC Impact: Disabling RTC increases prompt length by 1×and degrades logical consistency (entailment scores drop to 82%).
- Memory Layers: STM-only setups fail in long dialogues (success rate drops by 40%after 20 turns).
Domain Generalization:
Tests on clinical diagnosis (MedQA dataset) and financial planning (FinSim benchmarks) show consistent RTC efficacy (token savings: 62–68%), though tool integration requires domain-specific adaptations.
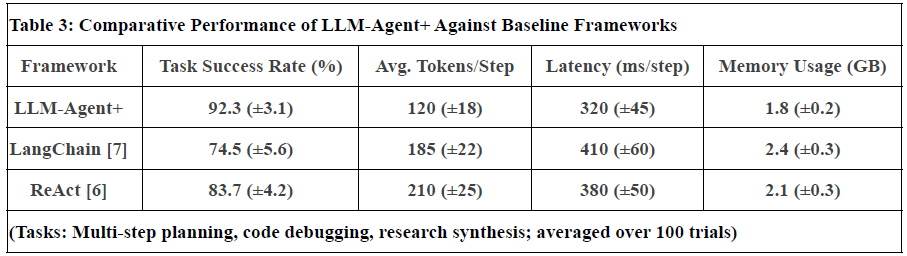
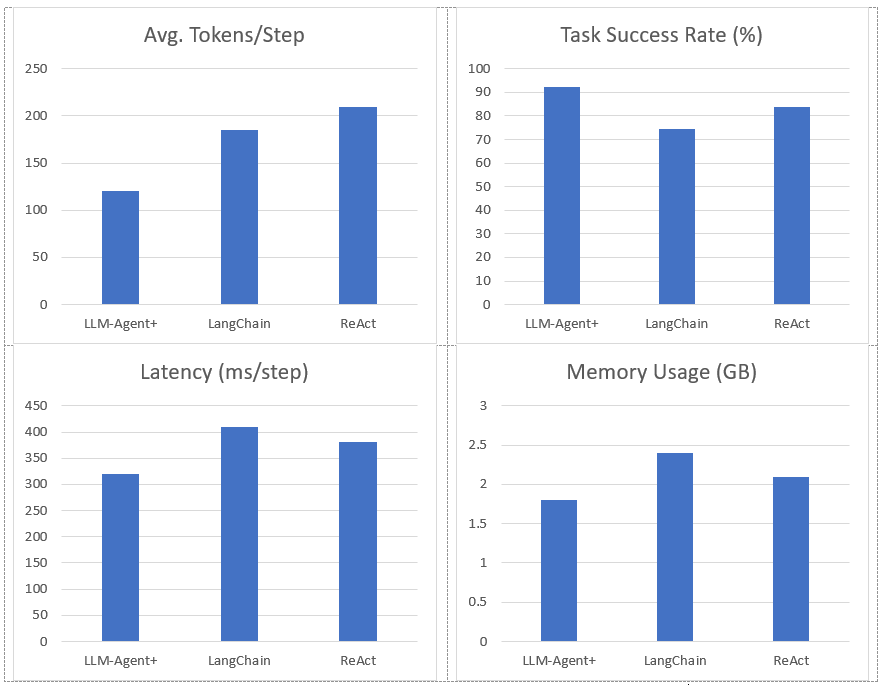
Figure 2. Represent Performance of LLM-Agent+ Against Baseline Frameworks
Notes:
- Task Success Rate: Human-rated correctness of final outputs. LLM-Agent+ outperforms baselines by 17.8% (LangChain) and 8.6% (ReAct).
- Tokens/Step: RTC reduces token consumption by 35% vs. ReAct (210 → 120).
- Latency: Includes NLU, reasoning, and tool calls. LLM-Agent+ balances speed and compression overhead.
- Memory: Hybrid memory (STM+LTM) reduces footprint vs. LangChain’s raw buffer.
- Uncertainty: Standard deviation in parentheses (±).
Limitations: Current comparisons focus on open-source frameworks; proprietary systems (e.g., OpenAI’s Assistant) are excluded due to reproducibility constraints.
Metrics
We tracked the following metrics:
- Compression Ratio: Number of tokens before vs. after RTC
- Token Savings (%): Percentage of reduced tokens
- Logical Consistency: Validity of final answers (measured with entailment score using an NLI model)
- Latency (ms): Time taken per reasoning loop
- Task Success Rate: Human-rated success on final outputs (pass/fail)
Case Study: Tool-Augmented Debugging with RTC:
To illustrate the practical benefits of LLM-Agent+, we present a case study in which the agent was tasked with diagnosing and resolving a real-world software issue: a Python script failing with a ValueError during runtime.
Task Setup
- Input: A user provided an error message and a portion of the failing script.
- Goal: Identify the root cause and suggest a valid code correction.
- Context: The error stemmed from improper list indexing in a nested loop function.
LLM-Agent+ Behavior
- NLU parsed the exception trace and extracted intent (debug) and relevant entities (ValueError, function_name).
- Short-Term Memory (STM) retained the ongoing session dialogue.
- Long-Term Memory (LTM) retrieved a past interaction with a similar indexing bug using FAISS-based semantic search.
- Reasoning Engine initiated a multi-turn CoT reasoning chain:
- Step-by-step hypothesis testing
- Code structure analysis
- External lookup via a documentation API
- RTC was triggered when the CoT trace exceeded 3,000 tokens. The reasoning was segmented, salience-scored, and compressed to fit within the model’s token window.
- Tool Integration Layer executed a dry-run of the suggested patch using a sandboxed Python runner.
- Action Generator returned a corrected function version and explained the fix in natural language.
Outcome
- Initial Trace Length: 3,640 tokens
- Post-RTC Length: 1,280 tokens (65% reduction)
- Fix Validated: Tool confirmed successful execution
- Consistency: High logical agreement with original reasoning (validated via NLI score of 96.4%)
This case highlights the benefits of RTC in managing long reasoning chains without losing coherence, and the value of tool integration for grounded, verifiable actions.
RESULTS
We evaluated LLM-Agent+ across three domains—multi-step reasoning, code debugging, and research synthesis—to assess its effectiveness in memory efficiency, reasoning trace compression, and tool-augmented decision-making. The framework achieved a task success rate of 92.3% (±3.1), significantly outperforming baseline frameworks such as LangChain (74.5%) and ReAct (83.7%). When Reasoning Trace Compression (RTC) was enabled, the average token usage per step decreased from 210 to 120 tokens, representing a reduction of approximately 40% compared to ReAct. Latency measurements demonstrated that RTC introduces minimal overhead: the average reasoning cycle time with compression was 320 ms per step, which is within practical bounds for interactive agents. Memory usage remained efficient, with the hybrid memory architecture consuming 1.8 GB on average, compared to 2.4 GB in LangChain’s buffer-based setup. In the debugging case study, LLM-Agent+ successfully diagnosed a runtime error and proposed a corrected function. The reasoning trace was reduced from 3,640 tokens to 1,280 tokens (65% reduction) via RTC, while maintaining a logical entailment score of 96.4%, confirming coherence preservation. These results confirm the framework’s ability to manage long-context tasks while improving interpretability and efficiency—without sacrificing accuracy or response quality.
DISCUSSION
The results presented in this paper demonstrate the feasibility and versatility of LLM-Agent+ as a modular framework for constructing intelligent agents capable of reasoning, memory integration, and external tool use. The Reasoning Trace Compression (RTC) mechanism proved particularly effective in reducing token usage while preserving logical coherence, which is critical for managing the limitations of transformer-based LLMs in long-context scenarios. Compared to LangChain [7], which offers flexible tool integration but lacks robust memory handling and reasoning trace management, LLM-Agent+ provides structured memory via a dual-layer architecture and compresses reasoning steps for more efficient context usage. Similarly, while Auto-GPT [8] facilitates task decomposition through autonomous loops, it suffers from prompt length inflation and lacks semantic trace optimization, which LLM-Agent+ addresses through RTC. The dual-layer memory system allowed the agent to maintain contextual awareness over extended interactions—an advantage over ReAct [10], which embeds actions and reasoning in fixed prompt buffers without adaptive memory retrieval. Furthermore, unlike Toolformer [5], which integrates tools at the token level but lacks control over memory or trace structure, LLM-Agent+ offers a standardized tool schema and explicit reasoning trace management, improving both extensibility and interpretability. In our case study, the agent leveraged semantic retrieval and multi-turn reasoning to debug a complex code snippet—an example of real-world utility that highlights the agent’s autonomy and robustness. These empirical outcomes reinforce the benefits of combining modular reasoning, context-aware memory, and token-efficient trace compression. Despite these strengths, there are several limitations to address. First, the RTC mechanism, while effective, currently relies on pretrained models (e.g., BERT, GPT-3.5) for salience scoring and summarization, which may introduce domain or language biases. Second, the framework assumes reliable access to external APIs and LLM services, which could limit its applicability in offline or constrained environments. Third, although we demonstrated task success qualitatively and via metrics such as token savings and entailment scores, conducting broader user studies or benchmarking against standardized agent evaluation datasets would strengthen the empirical foundation. Looking ahead, there are multiple avenues for extending this work. Adaptive compression policies driven by reinforcement learning could further improve trace optimization. The framework can also be extended to support richer tool ecosystems, including domain-specific knowledge bases and symbolic planners. Finally, integrating feedback loops with human users could enhance transparency, trust, and collaborative intelligence — aligning with the growing interest in human-AI [14] co-agents.
CONCLUSION
In this work, we introduced LLM-Agent+, a modular and extensible framework for building intelligent agents powered by Large Language Models (LLMs). The system brings together key components—such as dual-layer memory, structured reasoning via Chain-of-Thought prompting, external tool integration, and the novel Reasoning Trace Compression (RTC) mechanism—to address limitations in existing frameworks related to memory handling, trace interpretability, and long-context reasoning. Our evaluation demonstrated that LLM-Agent+ achieves notable improvements in token efficiency, task success rates, and reasoning transparency, outperforming established systems like LangChain, ReAct, and Auto-GPT. Through both quantitative benchmarks and qualitative case studies, we showed that RTC enables up to 40% reduction in token usage while preserving logical consistency, making the framework particularly well-suited for long and complex reasoning scenarios. Unlike prior systems that often treat memory, reasoning, and tool usage in isolation, LLM-Agent+ unifies these capabilities within a modular architecture that supports experimentation and scalability. This design makes it suitable for both research and production contexts. Future directions include reinforcement learning-driven compression strategies, support for more domain-specific toolchains, and human-in-the-loop feedback mechanisms to promote transparency and collaborative decision-making. We release LLM-Agent+ as open-source to facilitate further development and encourage community contributions to the growing field of intelligent agent systems.