مجلد : Volume 1
A Study of the Properties of Compost Garbage and its Effect on Germination and Breeding of Okra (Hibiscus Esculentus sp)
Barriers of Implementing E-Health in Developing Countries: A Case Study: Syria
INTRODUCTION
Growth and technological advances have immensely contributed to streamlining modern living. Almost every aspect of human life relies on the benefits of modern technology. The adoption of technology in the healthcare system is referred to as e-Health. According to Elharish et al [1], e-Health is the delivery of healthcare using modern electronic information and communication technologies. Healthcare services provided through electronic health include physical and psychological diagnosis and treatment, telepathology, vital sign monitoring, and teleconsultation, and the adoption of e-Health benefits healthcare practitioners and patients. Benefits of E-Health include saving time, reducing human errors, reducing healthcare costs, and giving patients insight into their health. The benefits of e-Health adoption have been seen in different regions worldwide. Despite the perceived benefits, developing countries show a go-slow in adopting e-Health. Prior studies explain the latter scenario from the funding and cost constraints perspective. However, other factors have contributed to the sustainable adoption of e-Health technology in developing countries. To facilitate swift and sustainable adoption of e-Health in developing countries, involved stakeholders should understand the connection between social, economic, and political factors challenging e-Health adoption in developing countries.
This research will expound the discussion on factors affecting the sustainable adoption of e-Health in developing countries using Syria as a case study. A meta-analysis of the current situation in Syria was conducted using online peer-reviewed databases such as Google Scholar, PMC, and PubMed. As mentioned earlier, the current study explains the slow adoption of e-Health in developing countries. The latter approach leaves many gaps in explaining the influence of social, political, and cultural factors impacting the adoption of e-Health in Syria. By addressing the research gap, the study will enhance the process of adapting e-Health in Syria and other developing countries. Sustainable adoption of e-Health requires a region to evaluate its capability and feasibility of the intended changes. However, external and internal factors within a jurisdiction compromise the latter moves. Developing the country’s economic, social, cultural, and organizational traits are among the most conspicuous factors affecting the sustainable adoption of e-Health. The situation in Syria is far worse than in many developing countries in the Middle East. The Syrian war has weakened the country’s ICT infrastructure, and the interplay between various cultural, economic, and war contributions has led to the unsustainable adoption of e-Health in Syria. Understanding factors compromising e-Health adoption in Syria gives the government a clear picture of evidence-based measures for improving its healthcare system.
The Syrian government has emphasized a decentralized healthcare system that focuses on providing primary healthcare at the village, district, and provincial levels. Irrespective of the measures embraced to streamline healthcare provision in Syria, the progressive wars in the region have seen a 60% decline in Syrian health care services. In addition to causing a decline in Syria`s population, the war in Syria is responsible for destroying healthcare infrastructure and, consequently, unsustainable adoption of e-Health. Medical facilities’ destruction has led to shortages of medications and medical supplies. In a report by the International Rescue Committee (IRC), Syria has a total of 507 hospitals (114 public hospitals and 393 private hospitals), which are distributed between cities unevenly. The latter statistics are grounded on attacks directed on healthcare facilities. According to Allah ham et al, (2022) [2]. Berlin-headquartered Syrian archive has documented videos of 412 separate attacks against a total of 270 medical facilities between 2011 and 2020. The progress of the Syrian war has increased healthcare disparities in the region, with an average of 706 persons per bed in 2020 compared to 734 persons per bed in 2011. The current situation in Syria requires immediate action, following that only 64% of hospitals and 52% of the region’s health care centers are functional [2]. Direct attacks on Syria`s health facilities and practitioners have seen a significant drop in healthcare practitioners. According to Karasapan (2016) [3], 70% of Syria’s healthcare providers have fled the country, with substantial cities experiencing mass migration of physicians. Aleppo, one of the major cities in Syrian, had 6000 physicians before the war, and by 2013 only 250 remained in the city. The deteriorating state of Syria`s health sector is also founded on reduced government spending on health as a percentage of GDP. According to Allahham et al, (2022) [2], Syria`s government spending on health reduced from 4.9% in 2005 to 3.4 % in 2010 and continued to reach less than half of the 2011 percentage.
Article Statement: The slow adoption of e-Health technology in developing countries is a multifaceted issue requiring responsible stakeholders to devise and resolve practical measures.
LITERATURE REVIEW
Lack of Awareness
The rate of technology acceptance varies with region and community members’ attitudes towards the technology. Cultural, economic, and social factors define innovation adoption rates resulting in five categories (innovators, early adopters, early majority, late majority, and laggards) of innovation [4]. Developed countries comprise early adopters and innovators. While innovators are motivated to accept trends in technology as soon as they emerge and appreciate technological changes, early adopters adopt new technology to achieve revolutionary changes and gain a competitive advantage. On the other hand, the early majority embrace technological changes to improve productivity. Syria and many developing countries fall into the laggards and late majority category. The latter categories are skeptical about innovative technology and are geared towards maintaining the current status quo. Cultural and organizational traits in Middle East countries explain the region’s unsustainable adoption of e-Health technology. Alajlani & Clarke [5] conducted case study research in Syria and Jordan to investigate cultural factors affecting the sustainable adoption of e-Health in the two regions. The study gathered data from key stakeholders in Syria and Jordan’s healthcare sector. Interviews and questionnaires were employed for a study population comprising 100 participants (50 from each country) and 45 professional participants (22 from Jordan and 23 from Syria). The study accessed the professional practitioners using face-to-face semi-structured interviews. The study aimed to investigate demographic traits in the two regions and identify factors likely to compromise e-Health adoption.
A thematic analysis revealed three interconnected themes; poor infrastructure, poor funding, and lack of technology training as significant factors leading to the slow adoption of e-Health. It was noted that Jordan was ahead of Syria in adopting e-Health. This was supported by the fact that Jordan started using e-Health technology way of Syria. Even though the two countries had problems funding e-Health programs, respondents from Syria did not perceive funding as a barrier to e-Health implementation [5]. Regardless of the noted difference, resistance from doctors and patients was a major factor affecting the sustainable development of e-Health. Lack of training and exposure to e-Health affected Syrian health professionals more than in Jordan. The latter findings align with the categories of innovators highlighted in the introduction. Syria falls in the laggard category of innovators, which explains why its health practitioners and patients display a go-slow in accepting e-Health.
Reform Challenges
Rapid development in information and communication technology requires community members and affected individuals to stipulate reforms in sectors affected by the changes. The innovation in e-Health creates an urge for health sectors to define structure and organizational changes. Attempts that are made to reform Middle East’s health sector have been met with notable problems that, in turn, lead to the slow adoption of technology. Al-Samarraie et al. [6] supported Alajlani & Clarke [5] with the arguments that Middle East’s go-slow in technology adoption results from stakeholders’ resistance. In a study to review progress in adopting and using telemedicine in Middle Eastern countries, Al-Samarraie et al. [6] conducted a literature review on 43 peer-reviewed articles published between 2010 and 2020. The research answered two questions “What is the current progress of adoption and use of telemedicine in the Middle East?” and “What are the key barriers to implementing telemedicine in the two countries?” Al-Samarraie et al. stated there are major cultural barriers affecting e-Health adoption in Middle Eastern countries include religious, traditional beliefs, literacy level, and linguistic barriers. The study also noted that the absence of laws and regulations to support the transformation process affected the sustainable adoption of e-Health. The legal and regulatory framework designed to guide the delivery of care in Syria shows that e-Health may compromise patients’ privacy, which eludes the nursing code of ethics. In addition to the reform challenges, other factors compromising the sustainable adoption of e-Health include organizational (poor training, media representation, insurance, and strategic planning), individual barriers, and poorly motivated healthcare workers.
Al-Samarraie et al, calculated the contribution of different factors in reduced rates of e-Health adoption in Syria as a percentage of the total number of barriers identified from the 43 peer-reviewed articles. The results showed that technological and organizational barriers are the most affecting factors.
Ay et al. [7] expanded on the factors affecting the sustainable adoption of e-Health by conducting cross-sectional, analytical, and observational studies. The study employed snowball sampling and structured questionnaires to collect data from the target population. A total of 196 surveys were carried out by a non-government organization in Jordan hosting Syrian refugees. Ay et al. findings align with both Alajlani & Clarke [5] and Al-Samarraie et al. [6] in that structural and social barriers limited the implementation of e-Health among Syrian refugees. The study’s findings provided insights to humanitarian organizations wishing to support Syria and other developing countries to adopt e-Health.
International intervention can facilitate the adoption of e-Health in Syrian. However, the government should evaluate its current situation to determine if the factors within its jurisdiction hinder the successful implementation of e-Health interventions. Granja, et al. [8] carried out a systematic review to evaluate the factors influencing the outcomes of e-Health intervention. The study found that e-Health intervention’s success depends on its perceived impacts on healthcare. According to Granja, et al [8], research on e-Health should be carried out before implementing the desired intervention. Even though Granja, et al did not directly contribute to Syria’s case study, they informed the research topic from the perspective of Syria’s current situation. Alajlani & Clarke [5] found that healthcare practitioners in Syria have the required awareness to support e-Health. The latter findings align with Granja, et al [8] whose finding indicates that research is a critical factor in defining the success of e-Health intervention. The fact that healthcare practitioners in Syria are not conversant with e-Health technology implies that they cannot explore e-Health. The overall impact is the unsustainable adoption of e-Health. The study also noted that the ICT barrier also challenges the sustainable implementation of e-Health in Syria.
Information Technology Barriers
Information and communication technology have been perceived as enablers of economic development. A notable discrepancy is, however, noted in developing countries whereby the poor are, in most cases, left out of enjoying the benefits of ICT. Touray, et al. [9] conducted a study to identify ICT barriers in literature and empirical findings and categorize the barriers into critical success factors. The study employed a systematic literature review and case study methodologies. The review analyzed 1107 articles published between 2000 and 2011, while the empirical data was collected through a total of 200 questionnaires to evaluate internet adoption at user levels. The achieved data were analyzed using open coding and non-hierarchical coding. The study found 43 ICT barriers using two different studies. Forty of the identified barriers were common in the two studies, while three arose from the empirical study findings. According to Touray, et al. [9], economic socio-culture (SC), economical (EC), infrastructure (IF), legal and regulatory (LR), technical (TN), and education skills (ED) compromised the adoption of e-Health in developing countries. The study concluded that politics and leadership and lack of internet exchange points are major barriers affecting e-Health adoption in developing countries.
Even though the study was not conducted in Middle Eastern countries, its findings align with the reports previously evaluated in this study. The three outstanding barriers affecting the adoption of e-Health in developing countries include lack of internet exchange points, interference from foreign governments, and micromanagement of e-Health.
Civil Conflicts
Regions with political instability and wars suffer numerous economic challenges that increase government spending on vital activities. Irrespective of the benefits of e-Health, the Syrian government has more stressed economic issues to handle from the ongoing war. In a study to evaluate the impacts of the Syrian war on the implementation of e-Health, Bowsher et al. [10] employed narrative hermeneutic methodology. The literature review included articles composed from 2000 onwards, whereas thematic analysis deduced common themes. According to Bowsher et al., altered security conditions in Syria require the healthcare sector to adopt and revise partial online training programs instead of focusing on in-person care delivery. The latter requirement does not align with the e-Health framework because e-Health offers in-person healthcare services. The role of e-Health in regions with political and civil instability is to expand and facilitate the delivery of care. It is, however, challenging that many regions with civil disruptions do not have the right resources to support the implementation of e-Health. Even though Bowsher et al. [10] have provided a detailed explanation of the effects of war on e-Health, their findings differ from previous findings [5-7]. The latter studies connected the poor adoption of e-Health in Syria to cultural, organizational, and social barriers. Bowsher et al. [10] explained the go-slow in e-Health adoption with arguments that conflicts require frequent changes in healthcare provision strategies, a move that requires plenty of resources. The scarcity of resources in Syria and many other developing nations makes it hard for the healthcare sector to adopt e-Health. However, Bowsher et al. agreed with previous studies that a lack of professional training also compromises the adoption of e-Health in Syria.
Factors affecting clinician adoption of mobile health tools
Clinician’s attitude towards a healthcare innovation plays a critical role in defining the success or failure of the healthcare innovation. Jacob, et al. [11] article reported the findings of a structured review article to explore the relevance of published studies regarding social, organizational, and technological factors compromising the adoption of e-Health in developing countries. The study evaluated 171 peer-reviewed articles from MEDLINE, PubMed, SAGE, and Cochrane online databases. Technological factors defining clinicians’ adoption of e-health include outdated systems, system errors, poor quality outcomes, and data security issues [11]. Even though technological barriers are crucial in hindering the sustainable adoption of e-Health, workflow-related factors arose as the main factor from the contacted literature. The world is witnessing a notable shortage of healthcare workers. This implies that nurses and other health care practitioners have tight fixtures to attend to, which leaves them no time to invest in advancing their technological skills. The situation in developing countries is worse because, apart from the shortage of healthcare providers, the region does not have enough resources to invest in continuous nurses training programs. Even though Jacob et al. concentrated on identifying physician-related factors, their findings relate to most of the articles contacted earlier in this review. For instance, technological factors identified in [5,8,9] are also highlighted in Jacob, et al study [11].
Decrease in physician-to-patient ratio
According to World Bank Report (2015) [12], the physician-to-patient ratio has been decreasing tremendously since the onset of the Syrian war. For instance, Syria’s physician-to-patient ratio has been declining since the onset of the war, from 1:370 to a current ratio of 1:546. Stephan [13] supported the latter ideology with findings that 30% to 60% of Syrian physicians have left their country.
Challenges in the adoption processes of e-Health
Zayyad & Toycan [14] highlighted how adopting e-Health technology in developing countries is crucial in managing healthcare facilities while ensuring they offer quality services to patients. They used a modified technology acceptance model (TAM) to highlight how to facilitate the implementation of electronic health records (EHR), and the reasons why the process should be undertaken in phases. However, as the facilitator, the Syrian government should bring the reality check to the table and display why the new EHR system benefits the health sector and healthcare dispensation. In this context, the impediment factors from different stakeholders in the sector should be handled at the initial stages to ensure a smooth transition. In essence, the most important factor that should be considered is how the communication, practicability, and implementation of the EHR system are supposed to be embraced by all the stakeholders involved because they will be vital in running the technological system.
Using the narrative hermeneutic methodology, Alajlani & Clarke [5] found five qualities that should be handled before the diffusion of innovation and invention of new technologies in any healthcare setting, and these adaptations help to ensure the success of the procedure. Individual attitudes also play a critical role in this process of adopting new technologies, and due to that reason, people are concerned with five qualities. These include relative advantage: where the individuals adopting the new innovation must see how it will improve the old ways of doing things. In addressing this issue, Syrian healthcare professionals are supposed to be taken through the way that the accessibility and the availability of patient information under the new system will reduce the time unless when they were using the old system. The latter findings were supported by Said [15], who used Egypt’s healthcare to highlight how under EHR, the patient’s past and current medical information are accessible with a single click and input of the relevant data. This will ensure that they can be assisted faster during an emergency because different healthcare professionals can view their medical history under one platform.
Learning Measures for Improving e-Health
Matlin et al. [16] used qualitative research methods to highlight the Syrian government’s role in the EHR system implementation to improve healthcare safety, efficiency, and quality, especially during the refugee crisis. Furthermore, the government is supposed to guarantee that it protects the patient’s privacy and personal rights as it is envisioned under the law. Namatovu & Semwanga [17], supported the latter study’s finding with qualitative research to learn how the process of presenting the EHR system compromises its adoption in Syria. The reason for their involvement is that they will be responsible for training the individuals who will take part in the final phase of inputting the patient’s information into the new system. Syria is a religious and conservative country that follows Islamic laws and principles, and it is vital to use these approaches to ensure civic education is available for all the people involved. Therefore, the transition from the traditional form of handling patient information is supposed to be put into the new system, and it should be carried out with utmost responsibility and care to avoid errors and misuse of the new data.
Shawahna [18] used CDSS systems research to indicate how the efficacy and quality delivery of Syrian and other Middle East countries healthcare in both rural and urban areas rely on communication, interaction, and association with various care providers, medical residents, physicians, nurses, and other interested parties in the medical field. Therefore, when the different stakeholders converge for the meeting, they should be made to understand that the change in the EHR system does not only impact them; it is a collective responsibility of all the other parties with whom they interact daily. The transition to electronic health records (EHR) is not an easy task for any health center or for the physicians, the hospital management, the members of staff, and the nurses who are usually at the center of these changes because they make the transition to become easier [17]. The essence of converging healthcare providers and other stakeholders is to ensure that they can understand the importance and significance of having operational electronic health records (EHR) and how it will change their lives.
In the initial process of implementing electronic health records (EHR), all interested parties should be called to stakeholder meetings to be enlightened and educated on their role in the procedure. The meetings should be frequently held during the initial stages to ensure that all parties comply with all the issues they are taught, and they should continue until everyone is conversant with what the EHR entails. The type of information nurses should start with the basic process of how the EHR system works from an outsider’s perspective, the security measures that are put in place to avoid third-party interferences, and the implications that should occur when the nurses breach those terms and conditions [19]. The legal procedures entailed in the EHR system are made in such a manner that they are supposed to be agreed upon by all parties through consent because of the private and personal information they hold. In this context, it means that before the whole EHR process is started, in-house communication, coordination, and planning are supposed to be laid out before implementation.
Significance of e-Health compatibility
Zayyad and Toycan [14] indicate how electronic health and technology should be compatible with the new system while advancing values and practices that ensure the innovation aligns with the healthcare practices of the state or government. In this context, healthcare professionals are supposed to know that the inclusion of technology in how healthcare services are undertaken is a concept meant to infuse the old methods into a new platform. The old information will only be input into the EHR, and no other changes will be initiated because the data in the old system will just be keyed in for easy accessibility. Namatovu & Semwanga [17] supported the earlier applications of e-Health by noting that the simplicity factor should also be part of the new EHR system so healthcare professionals can easily operate the new technology. Based on these analogies, they highlighted how adopters must believe they can easily master the new technology; because if they consider it difficult, the greater the resistance. Therefore, it is the duty of the management and the trainers to use the simplest way possible to ensure that all involved personnel will master the system within a specified time span.
Hossain et al. [20] conducted a study in rural Bangladesh using the TAM model to learn how the trial-ability of the new EHR system should be made before the whole process is fully implemented. The report of Salminen & Mursu [9] also supports this approach, where the trial period should show that all the parties involved in operating EHR can “play around’ with the new technology while exploring its capabilities. The trial period of any new technology comes with the chance for the adopters to make mistakes so that they can be rectified and changed to a simpler version, if any, is available. Hossain, et al [20] used 292 respondents where through the trials; the seriousness of resisting change by the adopters indicated that new technology could be learned with an open mind. Observable results: the adopter should have adequate evidence, information, and data on how the new EHR has succeeded in other situations. Most of the data and information should highlight EHR’s success, especially in bigger health centers that have included technology in all their services and their rate of offering quality services to their patients. Therefore, when the smaller healthcare centers adapt to the new changes, it is only meant to ensure that they are not left out when the whole system changes, and they familiarize themselves with technology in all their healthcare delivery [10]. In all these adaptations, it will help the nurses to have an open mind that when they advance in their careers, the bigger health centers are also using the technology, and therefore, it is essential for them to learn on a low-level scale before they are enrolled in other complex EHR systems.
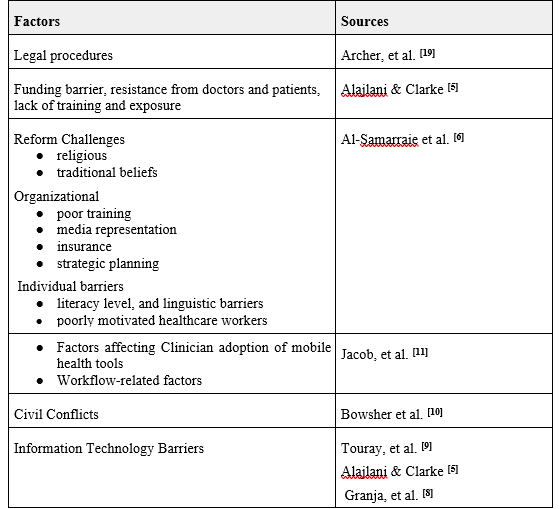
Summary findings:
By providing a clear and concise summary of the key findings from the literature, Table 1 could help to inform decision-making, guide the development of interventions and policies, and identify areas for future research.
Table 1. A summary findings table listing the barriers of implementing e-Health in developing countries based on research papers.
CONCLUSION
Electronic health is among the most promising trends in healthcare. Implementing e-Health is associated with many benefits to the healthcare department and other stakeholders in the healthcare docket. Irrespective of the benefits of e-Health, developing countries are lagging behind in its adoption. Using a case study of Syria, this article has identified some major challenges compromising the sustainable adoption of e-Health in developing countries. The most conspicuous challenge affecting arose from the lack of training and exposure to e-Health affected Syrian health professionals more than in Jordan [5]. Additionally, cultural barriers (religious, traditional beliefs, literacy level, and linguistic barriers) also compromised the sustainable adoption of e-Health [9]. The ongoing war in Syria negatively affected the implementation of e-Health since the government does not have adequate resources to facilitate the implementation process. Altered security conditions in Syria require the healthcare sector to adopt and revise partial online training programs instead of focusing on in-person care delivery. The latter requirement does not align with the e-Health framework because e-Health offers in-person healthcare services. In summary, the unsustainable adoption of e-Health in Syrian and other developing countries can be classified into three categories that, include social, systematic, economic, and organizational barriers.
RECOMMENDATION
Improving e-Health adoption in Syria and other developing countries is indeed crucial for advancing healthcare services and ensuring better access to medical facilities. Implementing effective measures to increase the consumption of e-Health requires a multi-faceted approach. We here list several proposed strategies:
Continuous Training for Healthcare Practitioners
Subjecting healthcare practitioners to continuous training on emerging technologies is an excellent step. It will equip them with the necessary skills and knowledge to effectively use e-Health tools and technologies in their practice. This approach helps address the issue of brain drain, where physicians leave the country in search of better opportunities abroad. By offering up-to-date training, the country can retain skilled professionals and attract others who want to work in a technologically advanced healthcare environment.
Investing in Modern Technology
Investing in modern technology is essential for upgrading healthcare facilities and providing healthcare practitioners with the tools they need to adopt e-Health practices. This could include providing hospitals and clinics with the necessary infrastructure, such as electronic health record systems, telemedicine platforms, and remote monitoring devices. By making these technologies available, healthcare practitioners can become more familiar with and embrace e-Health solutions.
Learning from Jordan’s Experience
Drawing insights from Jordan’s experience can be beneficial. As Jordan introduced e-Health technology earlier, it can serve as a valuable case study for Syria to understand the benefits, challenges, and best practices in implementing e-Health initiatives. This information can guide Syria in making informed decisions and avoiding potential pitfalls in its e-Health adoption process.
Addressing Cultural and Systemic Barriers
Cultural and systemic barriers can impede the successful adoption of e-Health in Syria. To overcome these challenges, investing in community-based education programs is essential. These programs should focus on educating healthcare practitioners and community members about the advantages of e-Health and dispelling any misconceptions or fears related to its implementation. By involving the community in the process, acceptance and support for e-Health initiatives can be significantly improved.
Encouraging E-Health Research
With a growing adoption of e-Health practices, there is an opportunity for Syria to invest in e-Health research. Research in this field can help identify areas for improvement, measure the impact of e-Health technologies on patient outcomes and healthcare costs, and refine the implementation strategies for better results.
Collaboration with International Partners
Syria can also benefit from collaborating with international partners and organizations experienced in e-Health adoption. These collaborations can provide technical expertise, financial support, and access to best practices, helping Syria leapfrog some challenges and accelerate its e-Health transformation.
In summary, enhancing e-Health adoption in Syria requires a comprehensive approach that includes continuous training for healthcare practitioners, investment in modern technology, learning from other countries’ experiences, addressing cultural and systemic barriers through community-based education, encouraging research, and fostering international collaboration. By implementing these strategies, Syria can pave the way for more efficient and effective healthcare delivery through e-Health solutions.
For These Reasons, Both Public And Private Sectors Should Prioritize The Support For R&D During A Post War Era In Syria?
Over a decade of war, unprecedented drought, COVID-19 pandemic, inflation, and recent earthquake, all made Syria’s economy struggle to stabilize and grow, while many Syrians are exploring options to cope and maintain basic needs such as electricity, irrigation and clean water. Lessons from countries around the globe tell us a lot. In fact, the boost of R&D in countries like Germany and Japan was basically initiated right after cannons became silent. During WWII, the United States Office of Scientific Research and Development (OSRD) greatly enriched public investments in applied R&D, where thousands of contracts between firms and universities were signed to perform research essential to the war and post-war efforts. The Islamic Republic of Iran is another interesting example. While the country is under intense sanctions, revenues from R&D activities in the past few years constituted a major share of the country’s GDP.
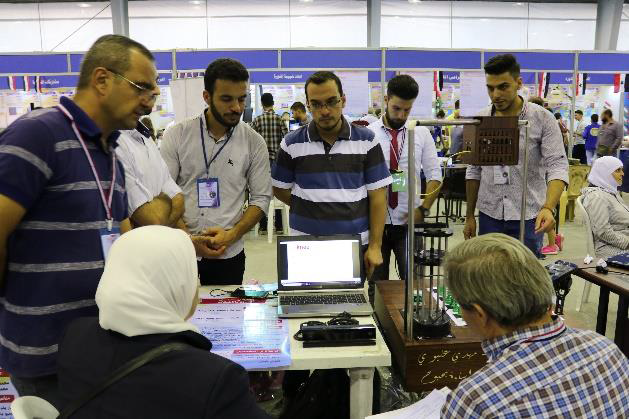
 Opening ceremony for the Fourth Syrian Expatriate Researchers Conference (SERC), 2022.
Investing in R&D activities is a prerequisite to speed up recovery and economic growth.
Current indicators in Syria show that R&D spending constituted only 0.02% of the country’s GDP in 2015, compared to 0.72 average in the Arab countries, 0.88% in Iran, 1.1% in Russia, 1.09% in Turkey, and 2.63% world average.
We seriously need to enhance spending on R&D in Syria and establish the correct and operational enabling R&D ecosystem for the following reasons: 1) R&D is the important driver of economic growth in the third millennium; 2) R&D might lead to innovative solutions to non-traditional challenges Syria faces; 3) Many local experts and skilled personnel could be attracted to R&D activities, which might mitigate their continuous migration out of the country; 4) without sustained R&D activities, Syrian goods will certainly loose competitiveness in local and global markets; 5) Due to war, Syria has lost a major fraction of the countries natural resources. This is why a gradual transform into a knowledge-based economy, which usually heavily relies on R&D, is badly needed.
The bottom line, R&D is suitable to all times, all situations, and more essential and worthy in the time of war than in the time of rest and peace.
Future Prospects of Thermochemical Conversion Processes of Biomass
Introduction
Due to rapid industrialization, urbanization, and population growth, the demand for energy and its resources is increasing annually. It is projected that global energy consumption will reach 812 quadrillion KJ in 2035, meanwhile, fossil fuels are still the dominant energy source. The use of petroleum and other liquid fossil fuels worldwide was 85.7 million barrels/day in 2008 and is expected to increase to 112.2 million barrels/day in 2035 (1). It is expected that we will deplete the entire global oil reserve by 2050 (2). Approximately 86% of global CO2 emission is associated with the use of fossil fuels with 2 billion tons year-1 discharged by coal-fired power plants as prevalent around the globe (3,4). Due to concerns over rising fuel prices, declining reserves of fossil fuels, and environmental issues such as pollution and global warming, a novel, sustainable approach to energy production is urgently needed. Biomass and fuels derived from its processing are one of promising alternatives to conventional fossil fuels (5). Sustainability, feedstock diversity, and low to no emissions of gasses such as soot, SO2, or NOx make biomass a promising energy source. However, treatment is needed for biomass to be converted into biofuels and chemicals that have ready use due to its high moisture and oxygen content and consequently lower energy-density compared to fossil fuels (6,7). According to Faaij (2006) research, bio-energy could meet current global energy needs with a potential of over 1000 EJ year-1 (8). Additionally, biofuels are carbon neutral as the CO2 released by their combustion is consumed again for the growth of other biomass via photosynthesis (1). Fig. 1 shows the conversion routes of biomass to bioenergy. Biogas, ethanol and biodiesel are examples of first-generation biofuels that are directly tied to biomass that is frequently edible (9–13). To make first-generation bioethanol, only a few distinct feedstocks are actually employed, namely sugarcane or corn. Brazil is one of the top countries using sugarcane as a feedstock for the manufacture of biofuels.
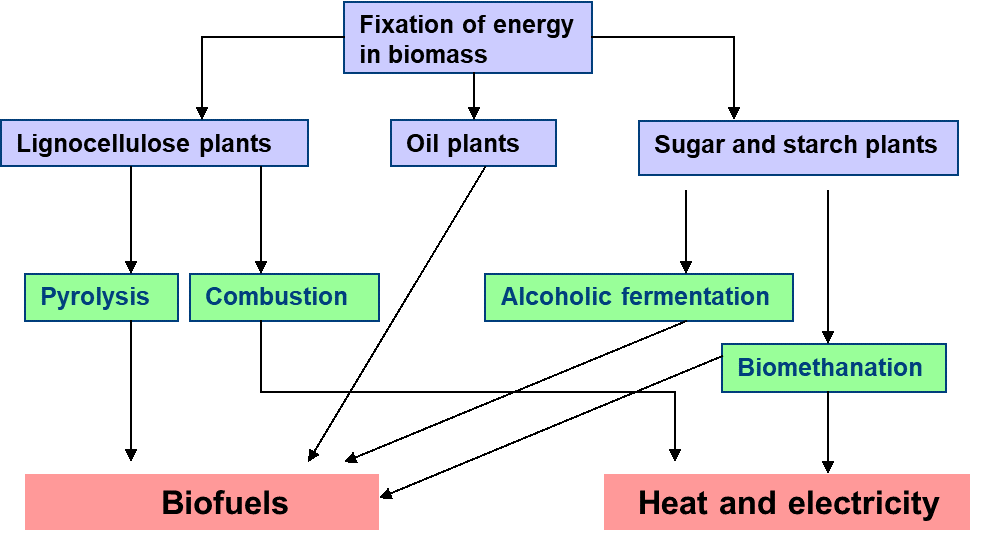
Fig. 1 Conversion of biomass to bioenergy
In the future, efficiency can be further improved through the development of superior crop varieties, improved crop management techniques, and advancements in ethanol production processes (8). The only other biofuel made on an industrial basis is biodiesel produced from oily plants and seeds and commonly used in Europe and Asia (14). There is a number of environmental and socioeconomic concerns around the first generation biofuels future perspective such as land use, food competitivness, and lifecycle (15). Moreover, the growth is dictated by biomass prices on the market. Some of these challenges are banished through newer generation fuels. Second generation biofuels utilize the range of different feedstocks such as non-edible lignocelulosic biomass, different residues and waste products such as bio-waste and municipal solid waste (14,16).
Thermochemical conversion
The most well-known method of converting biogenic waste is thermochemical conversion, which also includes pyrolysis, gasification, liquefaction, hydropyrolysis, and reforming (17–21). The biomass is transformed into hydrocarbons and synthesis gas through gasification, whereas pyrolysis and liquefaction directly transform the biomass at high temperatures into bio-oils, gases, and char.
Hydrothermal process
Energy-denser product is derived from biomass via hydrothemal conversion.As the technology operates in an aques environment, no pre-drying of the feedstock is necessery and biomass with higher moisture content can be directly utilized (22). HTC yields solid fuel (hydrochar) under temperatures between 180–280 for 5–240 min (23). From 250°C to 375°C and pressure of 10–25 MPa HTL takes place producing bio-crude or crude-oil,which is a liquid fuel consisting of insoluable organics (24,25). Bio-crude requires only slight upgrading to be used commercially while by-products of liquifaction have lucrative applications (i.e. fertilizer). Possible future research areas include setting up a plant suitable for both wet and dry feedstock, analyzing the influence of various parameters, optimizing for better conversion, and developing theoretical models to accurately represent the process depending on the feedstock (26). Moreover, When biomass is heated to high temperatures during hydrothermal liquefaction above 375°C the process is known as HTG, macromolecules are broken down into molecules with smaller molecular weights, creating syngas see Fig.2
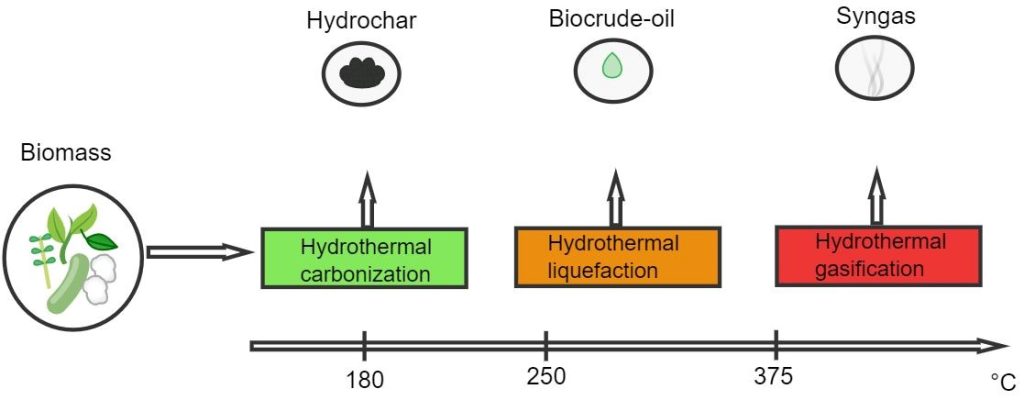
Fig.2 Hydrothermal process
Torrefaction
Torrefaction is a thermal conversion process used to pre-treat biomass converting it into a more uniform and energy dense product. Heating under inert atmosphere in the temperature range of 200-300°C enhances the fuel properties of biomass by improving combustion properties (27), homogenuity, physical and chemical properties making it similar to coal.The torrefied biomass is biologically stable, hydrophobic, and significantly lower in moisture content compared to raw feedstocks (28). It is expected that all traditional pelletisation facilities would transition to torreaction plants for the production of torrefied pellets. Furthermore, the biomass pre-treated like this is easier to handle and transport to locations where it can be applied for heating fuel, cofiring, gassification, etc. Optimisation of this technology is expected around combustor, heat exhangers, as well as nitrogen feed, while research is being conducted on techno-economical performance of the technology (7).
Pyrolysis
For the waste reduction of biomass conversion technologies entire carbon content of the feedstock should be converted into a valuable product (29). Pyrolysis distributes carbon atoms between biocrude, char, and syngas (30). Despite major success of recent engineering endovours on this topic (31), further research should be conducated on novel reactors with improved cost and overall effectiveness. Furthermore, intergeration with anaerobic digestion is a promissing future direction for higher quality bio-oil and solution of an environmental problem (29).
Gasification and biofuels
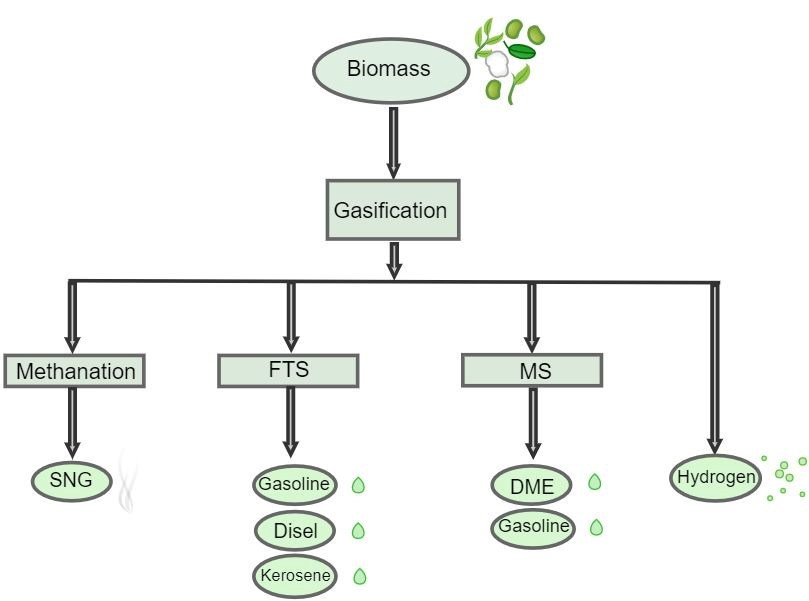
Gasification produces less toxic fuels compared to fossil that can use existing infrastructure. While commercial production of biofuels from gasification does not currently exist, there has been increasing interest and research on this approach over the past few decades. The gasification process produces syngas, a mixture of carbon monoxide and hydrogen, from biomass. This syngas then undergoes further chemical processing to produce fuels and chemicals that are readily available on the market as shown in Fig.3.

Fig. 3 Scheme of biofuels production through gasification
Through methanation synthesis gas is produced. FTS yields kerosene (jet fuel), disel, and gasoline liquid fuels. Several commercial-scale initiatives are currently in the works, especially in the United States but also in Europe and Japan, even though bio-FT is currently in the demonstration stage. The initiatives cover a wide range of end products and feedstock options. Even carbon capture and storage will be used in one project, the Bayou Fuels biorefinery in the United States, to create negative emissions, sometimes referred to as carbon dioxide reduction. Biojet kerosene has to make significant strides in order to align with the Net Zero Scenario by 2030. The success of biojet kerosene depends on reducing costs, implementing clear regulatory schemes and policies, and diversifying sustainable feedstock supplies beyond waste and edible oils. Synthesized methanol can be further upgraded into gasoline, DME (fuel additive), and polymers, as well as acetic acid and formaldehyde. Hydrogen that is produced in gasification process can be used directly as a fuel or to further synthesize ammonia and urea (8,32). According to IEA, these production pathways could enable renewable diesel and biojet kerosene to sustainably scale up to the levels necessary in the Net Zero Scenario as they utilize more abundant feedstock compared to some already commercially viable options such as HVO and HEFA (32). The equipment needed for these secondary processes is similar to that used for natural gas, but gas cleaning is more intensive. There have been some pilot projects demonstrating this approach, but technological challenges remain compared to other biofuel production methods. While current process technologies can be applied once clean syngas is available, further research and development are needed to improve gas-cleaning, scale up processes, and achieve higher efficiencies and lower costs through more advanced concepts like liquid phase methanol production and improved gas separation. Some countries are increasing interest and investment in research on advanced gasification for syngas production as a long-term strategy.
Hybrid Renewable System Technology
Another initiative to tackle energy challenges in a sustainable way is to adopt hybrid renewable energy systems. Such a setting that combines multiple renewable energy sources overcomes the issue of spatiotemporal variability of these resources. Compared to single resource-based energy generation systems, integrated renewable energy systems can increase energy storage capacity, reduce energy production costs, and improve the quality of generated power (33). Furthermore, such systems offer greater flexibility and promote overall socio-economic growth (34,35). Hybrid renewable systems incorporating thermal conversion of biomass with other renewable energy sources received considerable attention in research (35–39). For instance, Facchinetti et al. worked on the integration of a solid fuel cell-gas turbine cycle powered with hydrothermally converted biomass obtaining the efficiency of 63% (40). Heidari et al. performed hydrothermal carbonization of biomass. The hydrochar was used in the integrated system to produce power and process water in anaerobic digestion to obtain biogas later used as a gaseous fuel (41). On the other hand, biomass can be anaerobically digested to produce biogas that can be used to generate heat or electricity, while the digestate can be pyrolyzed in the integrated system to obtain gas, oil, and char. Deng at al. found that such a system could be self-sustaining by combusting pyrolytic gas and excess char. Another important aspect is the energy storage (42). Concepts such as Green to Green energy system aim to find a green storage system, such as fuel cell, for the green energy (43,44). Lin et al. proposed a plant for simultaneous generation of electricity and liquid hydrogen involving a lignocellulosic biomass gasification-integrated gas turbine and hydrogen liquefaction cycle with an electrolyzer process (45). Table 1 gives an overview of what other initiatives were taken on thermal conversion technology hybrid systems. However, study by Lee at al. showed that more research should be done on testing conceptually created models in real life conditions, addressing power fluctuation issues in the grid-connected system, removal of ash and moisture via pre-treatment technologies, etc (33).
Table 1: An overview of systems integrating thermochemical conversion of biomass with other renewable energy technologies
| Feedstock | System setting | Aim | Source | |
| Lignocellulosic biomass | Gasification concentrated solar thermal power | Electricity generation | (46) | |
| Fusion power gasification | Hydrocarbon fuel or hydrogen production | (47) | ||
| Adiabatic compressed air energy storage gasification | Electricity generation and energy storage | (48) | ||
| Bio-oil combustion – photovoltaics | Electricity generation | (49) | ||
| Anaerobic digestion – pyrolysis | Electricity generation and pyrolytic product production | (50) | ||
| Gasification – pyrolysis | Biochar production and electricity generation | (51) | ||
| Biomass combustion – biomass gasification – biomass pyrolysis photovoltaics – wind power vanadium redox battery-based energy storage system | ||||
| Seaweed/wood | Pyrolysis – anaerobic digestion | Methane production | (42) | |
| Wheat straw | Anaerobic digestion hydrothermal carbonization | Energy recovery | (52) | |
| Spent coffee ground | Hydrothermal carbonization – anaerobic digestion | Methane production | (41) |
Carbon capture and storage
IPCC’s Fourth Assessment Report highlighted that emissions must be diminished by 50-85% until 2050 to keep global warming below 2°C. Through IPCC’s Special Renewable Energy Sources and Climate Change Mitigation and Technology Roadmap Carbon Capture and Storage in Industrial Applications, bio-CCS was recognized as a single wide-reaching technology that could reach negative carbon footprint (53–55). It combines sustainable biomass conversion with CO2 Capture and Storage technology. For its growth, biomass absorbs CO2 from the atmosphere. Nevertheless, in conversion processes, CO2 is once more exhausted in the air. CCS technology aims to capture this exhaustion, deliver, and store it safely underground through natural mechanisms (residual, dissolution, and mineral trapping)(15).
The production of biofuels, such as ethanol fermentation and bio-FT, produces a high concentration of CO2 as a byproduct. As a result, these pathways have the potential to capture and utilize CO2 for storage or use. The cost of capture and transport is relatively low. Due to the high concentration of CO2 produced, no additional purification is required apart from dehydration. Once the CO2 is captured, it can be compressed and transported via pipeline, truck, or ship to a storage site or be used in some way. For example, captured CO2 has been sold for use in enhanced oil recovery or within the food and beverage sector. Researchers are exploring the potential of combining fossil fuels with sustainably grown biomass in flexible conversion facilities to produce fuels and other products. Gasification-based conversion platforms offer a flexible method for fuel production from biomass, coal, and natural gas. Combining sustainably grown biomass with (partial) CO2 capture allows for overall negative CO2 emissions per unit of energy produced on a life cycle basis. This approach can be used to produce hydrogen, where all carbon monoxide produced is shifted to hydrogen and CO2. A co-feeding strategy, such as with coal, can be attractive in the short term for organizing large-scale biomass supplies. When equipped with CO2 capture facilities, the input share of fossil fuel can still become “carbon neutral”. Negative emissions could be obtained by using more biomass. For instance, bio-CSS can be applied in large industrial operations where there is a local heat or power requirement, particularly in industrial clusters where CCS infrastructure can be shared. The use of biomass in the industry to replace fossil fuels has a variety of potential applications, including small and medium-scale heat and power, fuel substitution in cement kilns, and injection in blast furnace steel and iron-making. Existing large-scale gasification technology can be used to gasify biomass feedstock, which could be supplied as crude bio-oils obtained via pyrolysis or treated via torrefaction, reducing transport costs and facilitating feeding to pressurized gasification systems. Some exploratory work on large-scale and long-distance biomass supplies for large-scale syngas production has been done with promising results, indicating that this is a concept that deserves further study and development. European Technology Platform for Zero Emission Fossil Fuel Power Plants shows that an additional step further could be made by completely substituting fossil fuels and using bio-CSS in an independent bio-fuel production plant. Biomass is converted to char and gas in the gasifier. Char amounts for 6% of overall carbon content of the biomass. After gas treating, 52% of carbon content can be stored in CO2, while the remaining 42% are converted through FT- synthesis (15).
Conclusion
This review discusses the future of biomass conversion as a sustainable approach to energy production and carbon emissions reduction. It is an abundant and sustainable resource with the potential to reduce or entirely substitute fossil fuels. We explore different types of biofuels and conversion technologis specifically thermal conversion. Gasification is a promissing process to convert biomass into non-toxic fuels and useful chemicals while using existing infrastructure. For it to be applied on the industrial scale, further research on advanced tehniques is needed to improve gas cleaning and lower the costs of highly effective processes. Hybrid renewable energy systems incorporating thermochemical conversion are promising direction to tackle climate change and simultaniously overcome energy challenges in certain regions. However, more work should be done on the ways to maximize renewable sources fraction while minimizing the costs, real life testing, etc. Furthermore, carbon capture and storage technology combined with sustainable biofuels production could help achieve carbon negativity. International agencies such as IEA and UNIDO are highlighting the importance of scaling up such technologies in the near future and need for additional research in this direction so that Net Zero goals can be achieved.
Some Proposed Places as Marine Protected Areas in the Syrian Coast, and Their Topographical & Biological Properties

IP Management Clinic Will Focus on Agriculture

WIPO and Sidley Austin’s Emerging Enterprises Pro Bono Program are joining forces to help Micro, Small and Medium Size Enterprises (MSMEs) who are developing solutions for the agriculture sector that enhance food security or reduce pollution, water use or carbon emissions. Companies selected to take part in the IP Management Clinic will benefit from a program of activities spread over five months, specifically designed to address their IP management needs, as determined in the application process. They will receive advice on intellectual properties (IP) management strategies and guidance on how the IP system can be used to make their products, services or business model more competitive in today’s market.
To participate, Micro or SMEs must meet some criteria like having; an innovative green product or technology and a clear business model, a technology that is relevant to the agricultural industry, at least one registered IP right, an entrepreneurial team (a minimum of 3 people), in addition to other criteria.
It should be noted that The IP Management Clinic is a program that aims to help enterprises to better utilize IP as part of their business strategies.
To participate, applicants must complete the questionnaire by April 21, 2023.
Mobility-Aware Routing for Low Power and Lossy Networks
Introduction
The Internet of Things (IoT) makes all smart devices connect to the Internet anywhere at any time to form the Internet of Things [1]. Smart devices are described to be low power and limited capability of processor and memory. These devices can be linked together to form a network without an infrastructure in which nodes act as a router. Smart devices use IEEE 802.15.4 [2] and routing protocol RPL [3], but RPL did not support mobile nodes, so many researchers worked to improve it, but their results showed more overhead because of sending more control messages in the networks. other researches results were not accurate because of depending on RSSI value (Received signal strength indication) to detect the mobility of nodes, which is affected by obstacles and interference. Our contribution is to improve RPL protocol by making it able to ensure the nodes aware of the mobile node movement, so the node can reconnect to the network as soon as possible and reduce the disconnection time without increasing the transmission rate of control messages. The proposed protocol is lightweight and suitable for devices with limited and restricted specifications because it uses new control message which is not periodically sent.
The rest of this paper is organized as following: The first section introduces the RPL routing protocols, then related works are mentioned with discussions about the challenges of the research to design an efficient LLNs routing protocol. After that the proposed control message is explained, followed by the extensive simulation, performance evaluation and interpretations. Finally, the paper is concluded.
RPL (Routing Protocol for Low Power and Lossy Networks(LLN)) [3]:
In the network layer of the IoT protocol stack using 6LoWPAN technology, The RPL routing protocol was developed by (ROLL) group and was described in RFC (6550). RPL is suitable for fixed devices not the mobile devices. The root node serves as a gateway to the Internet for devices in the network. RPL organizes a topology as a Directed Acyclic Graph (DAG) that is partitioned into one or more Destination Oriented DAGs (DODAGs), one DODAG per root. It sends periodic DIO (DODAG Information Object) messages to inform nodes of its existence. It invites the neighbour nodes to call it, and in turn, each node that hears the DIO message and wants to communicate with root node will send a DAO (Destination Advertisement Object) message, then each node that communicates with parent node sends DIO messages to make the rest of the nodes connect and this process is repeated until all nodes are connected together, which is shown in Figure 1.
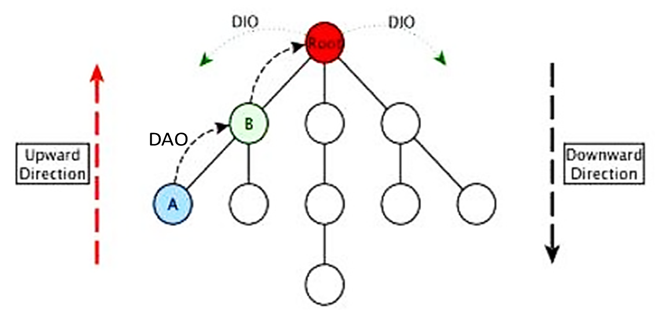
Fig. 1: Control messages used in RPL
The RPL protocol depends on the Trickle algorithm to manage the timers used to send periodic messages, to reduce the overhead on these networks. When the state of instability is detected, the transmission rate of control messages increases to spread updates quickly and reduces when the network is stable [4]. The node selects the parent node using Objective Function (OF) that depends on the number of hops, then it was developed to MARHOF (The Minimum Rank with Hysteresis Objective Function) [5] in which the parent node is selected based on the value of the Expected Transmission Count (ETX) that determine the quality of the link. The RPL protocol did not specify any mechanism for detecting routing adjacency failures of mobile node because such a mechanism causes overhead in bandwidth and power consumption. It is not suitable for Battery-powered devices to send periodic messages, so it requires external mechanisms to detect that the neighbour node is no longer reachable. This mechanism should preferably focus on links that were already used . [3]
Related work
Fotouhi (2015) proposed the MRPL protocol by integrating the RPL protocol with the smart hop using beacons. The protocol has two phases: the discovery phase and the data transmission phase. In the route discovery phase, the mobile node sends a broadcast of n DIS messages. The node that receives DIS messages calculates the ARSSI and adds this value within a DIO message. The mobile node selects its parent node that sent the DIO message with the highest ARSSI .[6] Gara (2016) suggested to use adaptive timer algorithm to regulate the transmission of DIO and DIS messages by the mobile nodes. The proposed algorithm computes (d) the remaining distance for a node to leave the parent node’s radio range by subtracting the preferred parent node’s radio range from the value of the distance between the two nodes. When (d) distance becomes shorter, the node discovers to find a new parent node. The researcher suggested using ETX and RSSI values to determine the best parent node .[7]Cobârzan (2016) proposed Mobility-Triggered RPL (MT-RPL) is a cross-layer protocol operating between the MAC and routing layers. It enables X-Machiavel operations to use information from layer 2 to trigger actions at layer 3 to ensure the node connects to the network. It reduces the disconnection time, increases the packet delivery ratio, and reduces overhead. A restriction of MT-RPL is that it relies on a fixed node that acts as an opportunistic forwarder for packets sent by a mobile node .[8]Wang (2017) proposed an RRD (RSSI, Rank, and Dynamic) method to develop the RPL protocol based on a combination of Received Signal Strength Indicator (RSSI) monitoring, Rank updating, and dynamic control message. It proposes a new DIO interval by modifying it dynamically according to Rank updates. RRD increased the packet delivery ratio and decreased the end-to-end delay and overhead, but it did not consider energy consumption .[9] Fotouhi (2017) proposed mRPL+ [10], when the link quality decreases during the transfer process with the parent node, the node will start sending periodic DIO messages to search for a better parent node. It also relied on the principle of overhearing to allow the parent node’s neighbour nodes listen for all messages exchanged in their radio range. When a neighbour node detects good link quality with the mobile node, it sends a DIO message to link with it. mRPL+ achieved good results in terms of the packet delivery rate, reaching 100%, but it led to more power consumption. Bouaziz and Rachedi (2019) [11] focused on two phases in the protocol, the first one is motion detection for the nodes, and the second is predicting the new connection before the current connection is lost. It relied on the principle of excluding the mobile nodes from the path to avoid interruptions caused by them and considered the mobile nodes as a leaf in the network that isn’t a router. EMA-RPL assumed that the node is moving away when the value of ARSSI decreases, but this is not always true because this value is affected by obstacles. Bouaziz (2019) [12] used the Kalman filter algorithm to predict the movement of mobile nodes and choose the parent node based on the predicted path. EKF-MRPL assumes that the mobile nodes will not participate in any routing process, but this is not always possible, especially in applications with many mobile nodes. Predicting movement and calculating distances are based on RSSI value which is inaccurate because it is affected by obstacles. Sanshi (2019) [13] modified the RPL protocol using fuzzy logic with several parameters (residual power, expected transfer count ETX, RSSI, mobility timer). FL-RPL uses the mobility timer parameter, which is the expected time to remain within the radio range depending on the location obtained from the RSSI value. This method isn’t accurate because it is affected by barriers and interference. Mobile nodes are considered leaf nodes and cannot participate in the routing process, This concept is not correct in the case of a network with more mobile nodes than fixed ones. Manikannan (2020) [14] used the firefly algorithm (FA) inspired by the firefly that produces light to communicate or attract prey or as a protective warning mechanism. When the distance increases, the light becomes weaker. It depends on choosing the parent node with a high RSSI value and re-implementing the FA algorithm until it reaches an optimal solution. In the simulation, only 12 nodes were used, and FA-RPL improved the packet delivery rate by 2.31%. The firefly algorithm (FA) is a good and powerful optimization algorithm, but its computational complexity is high .Safaei (2022) [15]. The research proposed ARMOR protocol by using a new parameter TTR to select the best parent node that will stay the longest within the radio range. TTR is calculated based on the node’s speed and position, and it is added to the DIO message. A new timer was added to increase the rate of sending DIO messages by the fixed node in order to introduce itself and to be selected as the parent node by the mobile nodes. The mobile nodes did not modify their timer, but this is not suitable for its neighbor nodes to be aware of their current speed in case it changes .The related works showed there was a need for a protocol that supports mobility, they worked on that but this led to an increase in delay and overhead in the network. In this research, new control message was proposed to make the nodes aware of parent node movement to take into account the appropriate time for changing the parent node without waiting for the timer specified in standard RPL protocol.
Table 1: Related works
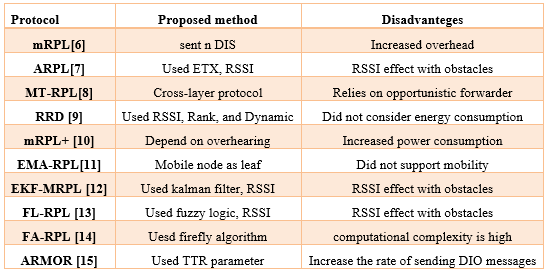
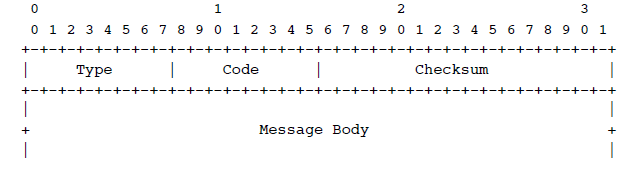
Fig. 2: ICMPv6 message format [16]
HERE Base object
HERE Base object is proposed to contain the following fields shown in Figure 3:
1- Flags: 8 bits. only 2 bits are reserved for S and H. the 6 bits remaining unused in the Flags field and reserved for flags. The field must be set to zero by the sender and must be ignored by the receiver.
(STOP) S: the ‘S’ flag indicates that the mobile node has stopped and sends a HERE message to its child nodes.
(LISTEN) L: the ‘H’ flag indicates that the node has heard Here message that is sent by mobile nodes and it is still within its radio range even after its movement, so the mobile node does not need to find a new parent node. However, if it moves and no such message arrives, the mobile node needs to find a new parent node as soon as possible to reduce the delay caused by separation resulted by moving the mobile modes when they change their place.
The values of all flag fields remain zero when a message is sent by the mobile node to its parent and child nodes if it moves to let them know.
(0,0) I MOVE TO HERE.
(0,1) LISTEN I’M HERE
(1,0) I STOP HERE.
(1,1) Invalid state.
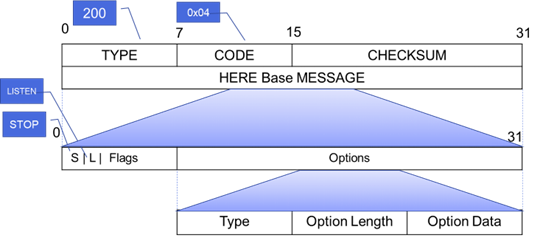
Fig. 3: HERE Base object
2- Control Message Option Format [16]:
No type of options was proposed, so padding will be used in proposed message. The general form of option contains three parts (Type, Option Length, Option Data). For padding option, the fields will be as following:
- Option Type: 8-bit, the value (0x00,0x01) is for padding type.
- Option Length: 8-bit, measured in octets, not including the Type and Length fields.
- Option Data: consists of N-2 zero octets.
The Pad1: option is used to add an octet of zeros for alignment. it has neither option length nor option data. The value of this type is 0x00. Pad1 is shown in Figure 4.

Fig. 4: Pad1
The PadN: option is used to add two or more octets of zeros. The value of this type is 0x01. PadN is shown in Figure 5.

Fig. 5: PadN
Proposed protocol rules
A mobile node must reconnect with a parent node within 5 seconds after it stops moving [17], so the following rules is suggested for proposed protocol:
- After sending a HERE message, a timer (HERE INTERVAL: 2.5 seconds) is triggered. If the LISTEN message does not arrive, then the mobile node will search for a new parent node.
- A node that has received a HERE message from a parent node has a timer run for 2.5 seconds. If it does not receive another HERE message indicating that the node is moving within its domain, then it will need to search for a new parent node.
- A node that received a HERE message from a parent node and did not receive another message after 2.5 seconds then has to wait for 0.5 seconds. After this period (STOP INTERVAL: 3 seconds), if it does not receive a STOP message, indicating that the mobile node has stopped and is still within its range, then this detects that this node is out of its range and will need to search for a new parent node.
- After the node stops moving for 3 seconds, it sends a STOP message to tell the child node that it has stopped. If the child node hears this message, it will not search for a new parent node. Otherwise, it will search for a new parent node. The mechanism of the proposed protocol is described in Figure 6. When the mobile node moves, it sends the proposed control message ‘HERE’ to children and parent node. As the parent node receives this control message, it sends a ‘STOP’ control message indicating that it is still within its domain. Otherwise, it will search for a new parent node. The child node which receives ‘HERE’ control message waits for a time “HERE INTERVAL”. After this period, if it does not receive another message, it has to wait for an additional time. If it receives a ‘STOP’ control message, this indicates that the node has stopped and is still in the same radio range. If the child node does not receive the STOP message, it will search for a new parent node.
The main purpose of this paper is to maintain the networks from disconnection for long time although of moving nodes, and to less changing parent node, so we make the node stay connected with the parent node although of its movement while it still in its radio range. The proposed control message is sent to inform the node of the change in the location of the parent node, which maintains communication between nodes by searching for the parent node immediately if it moves. The advantages of the proposed message compared to previous works that it is more suitable for LLN networks because it is sent only when node changes his location so it does not increase the overhead in the network.
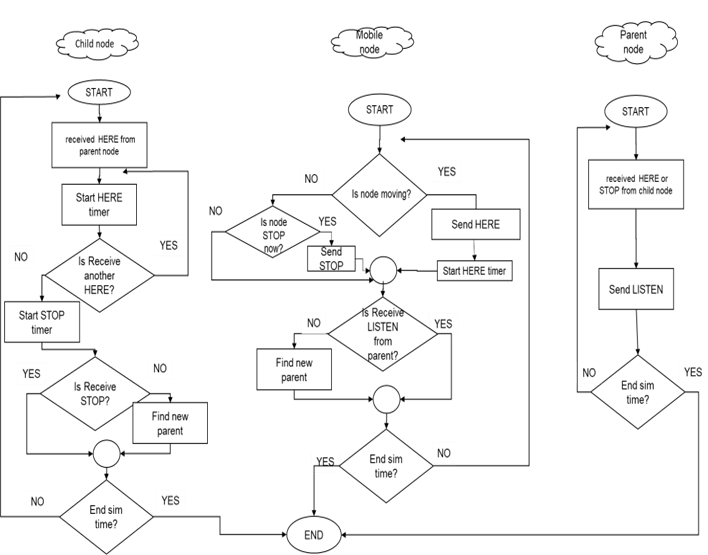
Fig. 6: The mechanism of the proposed protocol
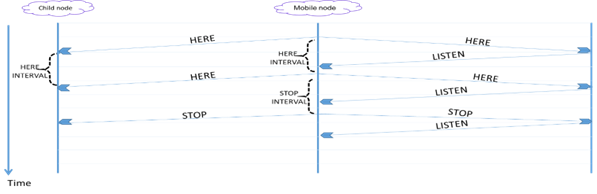
Fig. 7: Case study1
Figure 7 shows case study where all messages are received correctly despite of the mobile node movement. The parent and child nodes are still in the mobile node’s radio range.
Figure 8 shows another case study where the mobile node was moving, which led the child node to exit outside the mobile node radio range, so it did not receive a HERE or STOP message. After that, it will search for a new parent node. When the mobile node stops, the parent node is out of range, so it does not receive a LISTEN message and it will search for a new parent node by sending DIS messages to its neighbours.
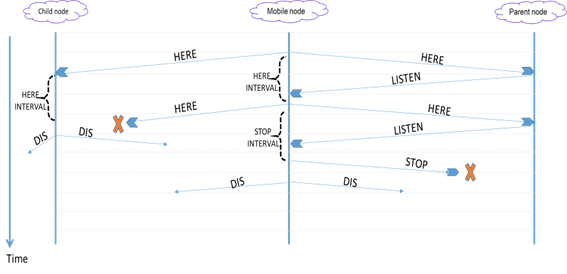
Fig. 8: Case study2
Protocol Performance Evaluation
In this paper, the proposed protocol was evaluated using the Cooja emulator [18] that supports IoT and all its protocols. Cooja is used because it is an emulator, not a simulator, meaning that its performance is closer to reality because it is running real devices in the network, which makes the results we get more
accurate and simulating reality. This emulator runs on Contiki OS which is open source, multitasking and designed specifically for constrained memory. It supports a wide range of low-power wireless devices, like a Z1 chip or sky mote, etc.
Performance metrics [13]
The proposed protocol was evaluated in terms of PDR, power consumption, overhead, and end-to-end delay. The calculations are as follows:
- 1. Packet Delivery Ratio (PDR): Represents the ratio between the number of received data packets and sent data packets.
- 2. overhead: The ratio between the number of routing packets and the number of successfully received data packets.
- 3. Average End-to-End Delay: The average time is taken to propagate the packet from the source to the destination.
- 4. Average power consumption: is the average amount of power used by nodes during the working time of devices in the network.
Simulation Results and Analysis
This section presents a performance analysis of proposed protocols compared to protocols MARPL, FL-RPL, and ARMOR. The networks in the simulation were built using Cooja program, where the simulation parameters were adopted according to previous studies that were compared with. The research [19] suggested the MARPL protocol, which adopted the idea of detecting node movement through the value of RSSI and determining the availability of the neighboring node. If the node receives a DIO message, it updates the Neighbor Variability metric, otherwise, if it receives DAO or DIS control messages, it reduces the time interval between each transmission of DIO messages, which increases their transmission rate and thus more overhead. In the simulation, a 300*300 m2 area was considered with 50 mobile nodes at a maximum speed of 3 m/s with a different number of root nodes (1,2,3). The results in Figure 9 show the value of the packet delivery rate which increases when the number of roots nodes increases.
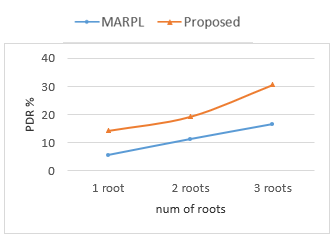
Fig. 9: Packet Delivery Ratio vs num of roots
By comparing the MARPL simulation results with the proposed protocol, we notice the superiority of the proposed protocol due to its ability to support mobile nodes by making the parent and child nodes of the mobile node aware of its movement via the proposed control message (HERE). MARPL increases the ratio of sending control messages, which causes more overhead on the network and increases collisions because it sends DIO messages to all neighbors, while the HERE control messages are sent only to the parent and child nodes that need this information. Average end-to-end delay: The result shown in Figure 10. Considering that MARPL relied on calculating the value of node availability through the RSSI, this leads to recalculating the value for all nodes every time. In the proposed protocol, even if the node moves and changes its location, it makes sure that the parent node is still within its radio range in order to reduce repeating the search process for a new parent node, and that reduces the power consumption, collision, and delay.
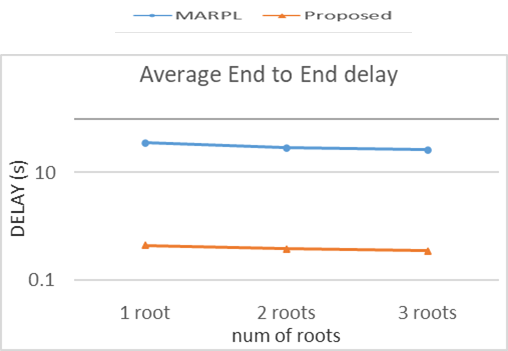
Fig.10: Average End to End delay vs num of roots
FL-RPL [13] is modified the RPL using fuzzy logic with several parameters. The simulation was implemented with an area of 10000^m2, 9 mobile nodes and (15,20,25,30) fixed nodes, the simulation results showed that the value of the packet delivery rate is close when comparing the proposed protocol with the FL-RPL protocol, where the proposed protocol exceeded 3% (Figure 11). The proposed protocol outperforms FL-RPL through reducing the delay by about half because the FL-RPL protocol performs many operations every time a node receives a DIO message, (see Figure 12). The routing metrics are given as input of fuzzy inference system to obtain a confidence score of the node and recalculate the mobility time. Therefore, these steps cause more delay and an increase in power consumption. Figure 13 shows that the proposed protocol reduced energy consumption, especially when the number of mobile nodes was more than fixed ones.
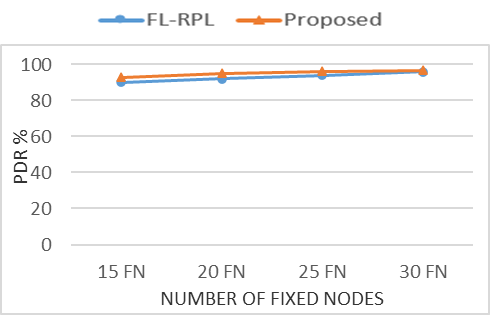
Fig. 11: Packet Delivery Ratio vs num of fixed nodes
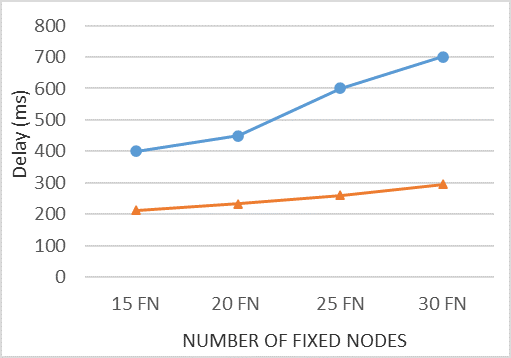
Fig. 12: Delay vs num of fixed nodes
ARMOR [15], the research proposed a new parameter TTR to select the best parent node that will stay the longest within the radio range. TTR is calculated based on the node’s speed and position, and it is added to the DIO message. In this paper, a new timer was added to increase the rate of sending DIO messages by the fixed node in order to introduce itself and to be selected as the parent node by the mobile nodes. The mobile nodes did not modify their timer, but this is not suitable for its neighbor nodes to be aware of their current speed in case it changes. The simulation was implemented with an area of 10000^m2, 20 nodes(10 static nodes and 10 mobile nodes) at a speed of 0.5 to 1.5m/s, and one root node. Another scenario was with 40 nodes (20 static nodes and 20 mobile nodes).
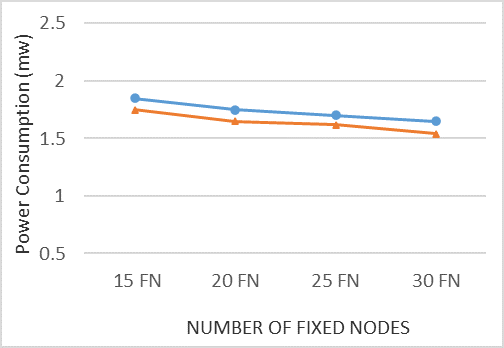
Fig. 13: Power Consumption vs num of fixed nodes
The simulation results showed that the packet delivery rate of the proposed protocol is 10% higher than ARMOR (Figure 14) because it supports mobile nodes by making them directly aware of the state of the parent node connected to them. If it becomes out of radio range, it will search for a new parent node.
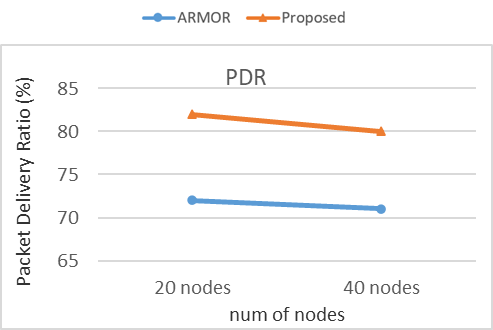
Fig. 14: Packet Delivery Ratio vs num of all nodes (mobile and fixed)
The routing load of the ARMOR protocol increased because it modified the timer algorithm for static nodes which made them send more control messages, so the mobile nodes are aware and communicate with them.
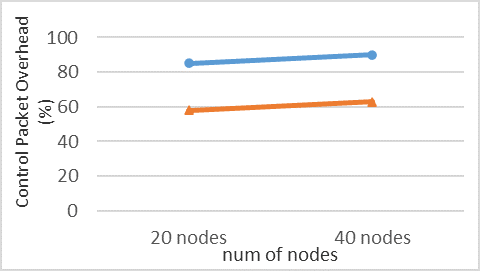
Fig. 15: overhead vs num of all nodes (mobile and fixed)
The proposed protocol did not increase the rate of sending control messages (Figure 15), so it was less routing load. It relied only on a suggested control message sent by the mobile node to its parent and child nodes when it moves. The power consumption of the ARMOR protocol is higher than the proposed protocol (Figure 16) because it sends more control messages.
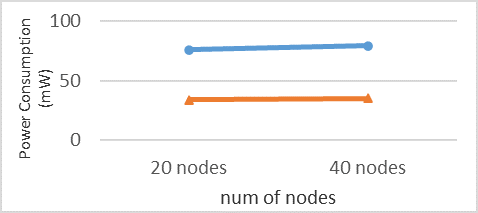
Fig. 16: Power consumption vs num of all nodes (mobile and fixed)
Discussion
The research shows the need to support mobile nodes in IoT networks. The proposed work helped to achieve this and reduce the impact caused by the nodes when they move within the network. From the simulation results, we observed that the proposed protocol improved the performance of the RPL protocol. It increased the packet delivery ratio because it made the parent and child nodes of the mobile node aware of its state. So they search for a new parent node immediately when the node moves away without waiting to expire the timer of the trickle algorithm, so it decreased the delay .The proposed protocol characterized that it doesn’t send control messages periodically because this is not suitable for the nature of LLN networks. It minimized overhead because it maintained routing adjacency, focused on links that are used by the mobile node, and did not depend on broadcasting the proposed control message to all neighboring nodes to be more suitable for this type of network because this decreased the power consumption. Therefore, the proposed protocol helps to spread the devices that support mobility (smart watches, smart vacuum cleaners) in IoT networks without impact on the network.
Conclusions:
In this research, a new mechanism is proposed to discover disconnection in the network and makes a node reconnect as soon as possible. This disconnection results from movement of the nodes. Our goal is to ensure that the protocol is lightweight while working to support mobility, because many related studies led to increased the overhead, and others depended on discovering movement of nodes through the value of the signal strength RSSI, which is affected by interference and barriers. The new control message ‘HERE’ is proposed to be sent by the node when it moves to both the parent node and its children. If the parent node receives this message, it will respond by LISTEN message, but if it does not receive LISTEN message, it will search for a parent node. If a node stops moving, it sends a STOP message to notify its child nodes. These operations were set with a timer under the standard times for this type of network. The results showed the superiority of the proposed protocol over previous studies because it helped to reconnect the nodes in the network quickly, which increases the packet delivery rate and reduces the delay caused by disconnections in the network when nodes move. Also, it did not depend on increasing the rate of sending control messages which causes an increase in the network overhead .As this paper focuses on supporting the mobility in LLN networks, our future work is to propose a method to determine the type of device (fixed / mobile) and suggest a mechanism for detecting the movement of nodes in real-time within the network and changing its parent node to more appropriate node, so that it reduces the number of changes the parent node .In addition, we will work on enhancing network stability depending on additional parameters to choose the parent node in the network. This research contributes to increase IoT spreading in many applications in several areas, such as parking system, smart home, health care, etc. Which contain mobile nodes without affecting network performance.
Mathematical Modeling of the Self-Compacting Concrete Samples Behavior Produced from The Syrian Raw Materials
Introduction
Many researchers are concerned with studying the behavior of concrete under the influence of compression loads. Then giving proposals for mathematical models through a mathematical extrapolation that explains the material behavior, which is determined by the relation between stress and strain (σ,ε). However, most of the proposed mathematical equations depend mainly on the results of the experimental tests which could be similar in the general shape with variation in the terms of its application, while depending on the mechanical, chemical, and physical properties of the various particles of concrete. In comparison with the studies that were carried out on concrete containing chemical and filler additives, such as hydraulic, pozzolanic materials, and chemical additives such as plasticizers [1], the topic of SCC self-compacting concrete containing improved materials and the effect of these materials on the molecular structure of the material is considered an important one for research. This is due to the effectiveness and wide spread of this type of modern concrete SCC in many engineering applications. Mohammed H M presented an experimental investigation on the stress-strain behavior of normal [2] and high-strength self-compacting concrete, with two different maximum aggregate sizes. The results show that the ascending parts of the stress-strain curves become steeper as the compressive strength increases, and maximum aggregate size decreases. Jianjie Yu studied the changing regularity of rubber particles’ impact on self-compacting concrete deformation performance [3]. The results show that the rubber particles in self-compacting concrete is more uniform distribution, compared with the reference group. In addition, Selvi K presented an experimental investigation on the modulus of elasticity of self-compacting concrete, involving various flying ash proportions [4], where the stress-strain relationship was studied for the M20 concrete mix. All previous research has studied self-compacting concrete containing fine filler additives, such as flying ash [5]. That gives the concrete distinctive fresh and hardened properties.
This paper will present the production of self-compacting concrete SCC clear of fine fillers by using cement as a fine material that is available and representative of those additives’ fillers.
Materials and Methods
Many previous studies and research have discussed the performance of concrete and described its behavior using the stress-strain curves (σ,ε). This expresses the mechanical behavior of the material [6], throughout deducing a formula that enables us to analyze the behavior of concrete mathematically. In 1951, HOGNESTAD proposed mathematical formula (equations 1 and 2), this enables us to describe the relationship between stress and strain in the ascending, and descending parts of curves [7] for traditional concrete. Figure /1/. So, stress f_c is calculated as a function of the relative strain $ (\frac{\varepsilon_c}{\varepsilon_{co}}) $.
$ f_{c,1}=0.85{f\prime}_c\left[2\frac{\varepsilon_c}{\varepsilon_{co}}-{(\frac{\varepsilon_c}{\varepsilon_{co}})}^2\right]\ \ \ \ \ \ \ \ \ \ \ \ \ \ \ \ \ \ \ \ \ \ \ \ 0>\varepsilon_c>\varepsilon_{co} $ (1)
$ f_{c,2}=0.85{f\prime}_c\left[1-{0.15(\frac{\varepsilon_c-\varepsilon_{co}}{\varepsilon_{cu}-\varepsilon_{co}})}^2\right]\ \ \ \ \ \ \ \ \ \ \ \ \varepsilon_{co}>\varepsilon_c>\varepsilon_{cu} $ (2)
$ f_{c,1} $: the stress of the concrete in the ascending part MPa.
$ f_{c,2} $: the stress of the concrete in the descending part MPa.
$ {f\prime}_c $: the maximum compression strength of the concrete MPa.
$ \varepsilon_{co} $: the strain corresponding to the maximum compression strength of the concrete.
$ \varepsilon_{cu} $: the critical strain of the concrete.
$ \varepsilon_c $: the strain of the concrete.
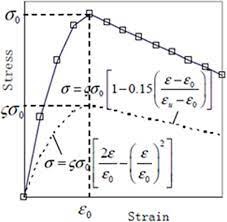
Fig. 1. HOGNESTAD stress-strain curve
KENT and PARK also presented, in 1971, a proposal for a stress-strain curve model Equation 3 for the confined and unconfined concrete with the descending part only [8]. Figure /2/. So, the stress fc is calculated as a function of the strain corresponding to the maximum strain εco, and the critical strain
$ f_c={f\prime}_c\left[1-\frac{0.5}{\varepsilon_{50u}-\varepsilon_{co}}(\varepsilon_c-\varepsilon_{co})\right]\ \ \ \ \ \ \ \ \ \ \ \ \ \varepsilon_{co}>\varepsilon_c>\varepsilon_{cu} $ (3)
$ \varepsilon_{50u}=\frac{3+0.29{f^\prime}_c}{145{f^\prime}_c-1000}{f^\prime}_c(Mpa) $

Fig. 2. KENT and PARK stress-strain curve
Also, in 1973 POPOVICS presented mathematical formulas. Equation /4/ describing the stress-strain relation of concrete [9]. It was considered that the relative stress as a function of the relative strain according to the following:
$ \frac{f_c}{{f\prime}_c}=\left[\frac{n\frac{\varepsilon_c}{\varepsilon_{co}}}{\left(n-1\right)+{(\frac{\varepsilon_c}{\varepsilon_{co}})}^n}\right] $ (4)
$ n=0.058.{f\prime}_c+1 $
He also presented a mathematical formula. Equation 5. in order to calculate the strain of concrete as a function of the maximum compression strength in the concrete:
$ \varepsilon_{co}=\frac{2{f\prime}_c}{12500+450{f\prime}_c} $ (5)
As for CARREIRA, he followed what POPOVICS had reached and developed a mathematical formula. Equation /6/ for calculating stress as a function of strain [3], where he took the effect of the concrete elasticity factor into account. As follows:
$ \frac{f_c}{{f\prime}_c}=\left[\frac{R(\frac{\varepsilon_c}{\varepsilon_{co}})}{\left(R-1\right)+{(\frac{\varepsilon_c}{\varepsilon_{co}})}^R}\right] $ (6)
$ R=\frac{E_c}{E_c-E_O} $
Where:
$ E_c=5000.\sqrt{{f\prime}_c}\ Mpa $
$ E_O=\frac{{f\prime}_c}{\varepsilon_{co}} $
$ ???: is the strain at the maximum compressive strength of confined concrete ?′?. $
The European Code EN 1992-1-1 also presented a mathematical formula. Equation /7/describes the stress-strain behavior of concrete [4] as a function of the relative strain $ \frac{\varepsilon_c}{\varepsilon_{co}}, $, and related to the elasticity factor of the material. According to the following:
$ \frac{f_c}{{f\prime}_c}=\left[\frac{k\eta-\eta^2}{1+(k-2)\eta}\right] $
$ \eta=\frac{\varepsilon_c}{\varepsilon_{co}} $
$ k={1.05.E}_c\frac{\varepsilon_{co}}{{f\prime}_c} $
SCOPE OF WORK
The Fresh Properties of Self-Compacting Concrete
Three mixtures of self-compacting concrete SCC were produced, in addition to the reference mixture, in different cement quantities [11]. The proportions of materials for the mixes are given in Table 1.
Table 1. The proportions of materials
| Mixture | Cement quantity (kg/m3) | W/C | Superplasticizer (%) | Coarse Aggregates (kg/m3) | Fine Aggregates (kg/m3) |
| SCC | 550
500 450 |
0.390 | 2.0
2.5 2.5 |
625 | 1000 |
The tests of the fresh properties of SCC were conducted [14]. They include J-ring Test, Slump Flow (SF) and Test, Visual Stability Index (VSI), and Segregation Test (SR). As shown in Figure 3.
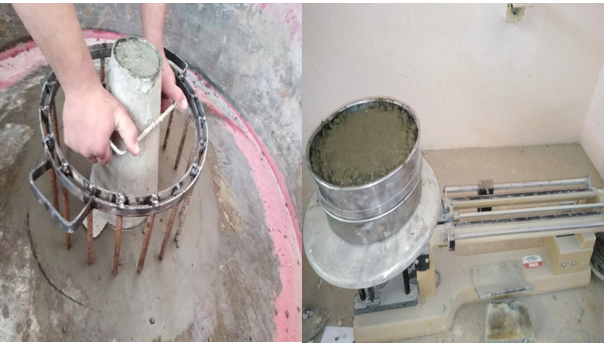
Fig. 3. SCC-HRW Fresh Properties Tests
The rules for adopting the ratio of superplasticizer depend on the technical specification and guidelines for using this type of material, where the recommended ratio range (from 0.5 to 2.5) % of cement weight. In the lab tests, the initial ratio was 1% and then increased till it achieved the required operability in each one of the mixes.
It was found that the mixture with a proportion of cement quantity (550 kg/m3) containing plasticizer coded as HRW gives the preferred properties the operability, Table /2/. The mixture with (450 kg/m3) cement quantity does not give any of the required properties for this type of concrete.
Table 2. SCC fresh properties:
| Mixture | Cement quantity (kg/m3) | W/C | Superplasticizer (%) | Slump Flow SF (cm) | (sec) | J-ring (DJ %) | Segregation Test (SR%) | |
| SCC-HRW-550 | 550 | 0.39 | 2.0 | 58 | 5.40 | 86 | 6.42 | |
| SCC-HRW-500 | 500 | 0.39 | 2.5 | 52 | 4.86 | 96 | 4.06 | |
| SCC-HRW-450 | 450 | 0.39 | 2.5 | – | – | – | – | |
| Allowed | 55-65 | – | ≥80% | ≤15% | ||||
Strength of SCC Samples on the Axial Compression
The laboratory tests result of SCC cylindrical samples produced locally at uni-axial compression [13] show the contribution of the plasticizer by reducing the ratio W/C up to 13%. Thus, there is an improvement in the SCC concrete in terms of strength and strain behavior. Figure 4.
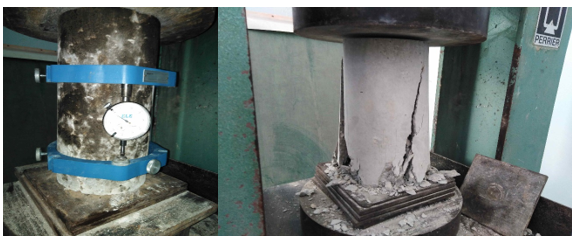
Fig. 4. Fracture Test of SCC Cylindrical Samples
According to laboratory tests, an increase in the strength of concrete containing plasticizer HRW (high reduction water) by 2% of the cement weight up to 12% has been noted, compared to the reference sample, which has the same proportions of materials but without a plasticizer.
The plasticizer in all concrete mixtures contributed to an increase in the operability and a decrease in the W/C ratio. The percentage up in the strength was due to the quantity of cement used, the type of plasticizer, the percentage of plasticizer, and the W/C ratio [12]. The decrease in the compression strength was observed by using a lower quantity of cement with a higher percentage of plasticizer. This can be explained by the change in the molecular structure of SCC mixtures when the ratio W/C is stable. So, it is better to use a higher quantity of cement for a lower plasticizer percentage, and stability by a ratio of W/C.
Since the concrete molecular structure is made up of two components, aggregates and paste. Aggregates are generally classified into two groups, fine and coarse, and occupy about 70% of the mix volume. The paste is composed of cement, water, and entrained air and ordinarily constitutes 30% of the remaining volume.
The major change in the molecular structure of the mixture under the influence of the superplasticizer is on the cement paste, which affects one component or more of the three mentioned.
Table 3. below shows the increase in the cylindrical compression strength depending on the cement quantity, the percentage of plasticizer, and W/C ratio.
Table 3. Compressive strength of SCC mixtures
| Mixture | Cement quantity (kg/m3) | W/C | Superplasticizer (%) | Compression Strength (MPa) | Strength Increase Ratio (%) |
| RS-550 | 550 | 0.448 | – | 33,572 | – |
| SCC-HRW-550 | 550 | 0.39 | 2 | 37.616 | 12 |
| RS-500 | 500 | 0.448 | – | 27.717 | – |
| SCC-HRW-500 | 500 | 0.39 | 2.5 | 28.249 | 1.9 |
| RS-450 | 450 | 0.448 | – | 24.680 | – |
| SCC-HRW-450 | 450 | 0.39 | 2.5 | 24.890 | 0.01 |
In the mixes with cement quantities 450 kg/m3, it is noted that the compression strength takes the same result with or without a plasticizer. This can explain the excess dose of the plasticizer causes additional dispersion and scattering of the cement granules, due to the repulsion of the negative charges that envelop them. Thus, there was a lack of bonding of the cement granules. Another reason that could occur was an increase in the additional air to the mixture.
Figure 5. shows the relation between the strength and the plasticizer percentage used, according to the quantity of cement in the SCC samples.

Fig. 5. SCC Strength and Plasticizer Percentage Relation
According to the previous data of the tests, and by searching for the mathematical equation that is closest and most representative of the relation between the strength of SCC and cement quantity and by using Curve Expert1.4 software program for processing curves, many mathematical curves were obtained. Figure 6. shows the closest curves to the study case with correlation coefficient R.
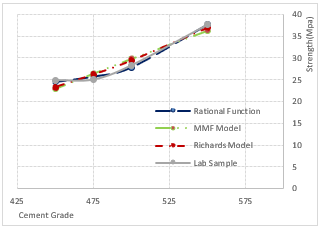
Fig. 6. The Closest Mathematical Curves
The above three mathematical graphic curves are closest to our experimental tests. It is clear from Figure 6 that the model known as the Rational Function gives the closest model with the best correlation factor R closer to 1. Equation 8, the realistic behaviour of the SCC, and the most expressive of the relation between the cement quantity and the strength of the self-compacting concrete, on the axial compression for different plasticizer ratios. While the other curves show a continuous sharp decline in the strength between the defined points, and an infinitely increasing of strength. This contradicts the relation between the concrete strength and the cement grade.
The Equation of Rational Function is given as:
$ y=\frac{a+bx}{1+cx+dx^2} $ (8)
y: Compression Strength of SCC (MPa).
x: Cement Grade (kg/m3).
a,b,c,: Equation constants, substituting the values of the constants into Equation (1). Founded that the equation takes the following form (9):
$ y=\frac{-45572.93+48.36x}{1-7.74x+0.0124x^2} $
Proposed Model of the Stress-Strain Formula for the Self-Compacting Concrete
The chemical materials in the self-compacting concrete led to a change in the molecular composition of the material. Thus, a change in its mechanical properties affects the behaviour of the concrete in fresh and hardened cases.
Through the application and analysis of previous models of the relation between stress-strain on SCC prepared in the lab, it was found that models can express the behaviour of concrete SCC in varying proportions. As for, the convergence was clear with the lab model, in the ascending part of the curve until reaching the ultimate stress Figure 7. But the difference was in the descending part of the curve. Therefore, it was interesting to search for a mathematical model that describing and expressing the closest behaviour for SCC in ascending and descending parts of the curve.
To understand the behaviour of hardened concrete, and through accurate processing of the numerical results of the fracture tests on the uni-axial compression of cylindrical samples. Models were achieved to describe the stress-strain occurred under the influence of the uni-axial compressive force.
To obtain a general unconditional formula, unrestricted in terms of the quantity of cement and the proportion of plasticizer used in the mixture. Data were processed and converted into non-dimensional relative values allowing the conversion of the data from the specific case into the general state of the tested concrete.
 Fig. 7. SCC and Reference Stress-Strain Curves
It was started from the same premise of previous studies and models in mathematical treatment by converting stress f_c into relative stress by dividing it by $ {f\prime}_c $, and the measured strain \varepsilon_c into relative strain by dividing it by $ \varepsilon_{co} $. So, the values of the mathematical treatment for stress and strain, are according to the following:
$ \frac{f_c}{{f\prime}_c} $: nominal relative stress, where: $ {f\prime}_c $: the maximum cylindrical strength of the concrete.
$ \frac{\varepsilon_c}{\varepsilon_{co}} $: nominal relative strain, where:$ \varepsilon_{co} $: strain corresponding to the maximum stress of the concrete.
To find a mathematical model that expresses the behavior of this type of concrete, the results of lab experiments of samples produced of SCC were entered at several cement quantities, and by defining it as nominal relative values $ \frac{f_c}{{f\prime}_c} $, $ \frac{\varepsilon_c}{\varepsilon_{co}} $ to obtain the optimal mathematical curve for this case, which gives the best correlation coefficient R and the smallest standard error.
The treatment showed that the most appropriate mathematical formula for the curve, in this case, is the Rational Function form, Equation 10. which is the general form:
$ y=\frac{a+bx}{1+cx+dx^2} $ (10)
y: the compressive strength in the concrete.
x: the strain in the concrete.
a, b, c, d equation constants.
The equation shown above and in its general form does not achieve the conditions of the model we are looking for, in terms of stress and relative strain. Figure 8 below shows the experimental and the equation curves form:
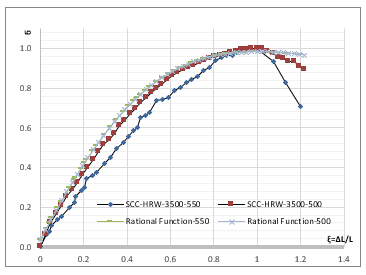
Fig. 8. SCC and Rational Function Equation Stress-Strain Curves
Starting from the performance form of the SCC expressed by the stress-strain curve. The equation was reformulated of the closed model in its general form, using the values of relative stress and strain. So that form of Equation 11. and Equation 12. becomes according to the following:
$ \frac{f_c}{{f\prime}_c}=\frac{a+b(\frac{\varepsilon_c}{\varepsilon_{co}})}{1+c(\frac{\varepsilon_c}{\varepsilon_{co}})+d{(\frac{\varepsilon_c}{\varepsilon_{co}})}^2} $ (11)
$ f_{cnorm}=\frac{a+b(\varepsilon_{cnorm})}{1+c(\varepsilon_{cnorm})+d{(\varepsilon_{cnorm})}^2} $ (12)
$ f_{cnorm}=\frac{f_c}{{f\prime}_c} $ nominal relative stress
$ \varepsilon_{cnorm}=\frac{\varepsilon_c}{\varepsilon_{co}} $ nominal relative strain.
Deduction of the Constants for the Proposed Stress-Strain Mathematical Formula Model
To deduce the constants of the proposed equation for the stress-strain curve. Starting from the initial conditions, which are:
First condition:
The beginning of the curve we have \varepsilon_{cnorm} and f_{cnorm} equal to zero. That is: $ \varepsilon_{cnorm}=0, f_{cnorm}=0 $, therefore by substituting the values into the equation 12. The result is shown in the Equation 13:
$ 0=\frac{a+b(0)}{1+c(0)+d{(0)}^2}\ \ \ \ \ \ \ \rightarrow a=0 $ (13)
Second condition:
At the peak of the curve. The value $ \varepsilon_{cnorm}=1 $ corresponds to the value of $ {\ f}_{cnorm}=1 $, the result is shown in the Equation 14:
$ 1=\frac{b(1)}{1+c(1)+d{(1)}^2}\ \ \ \ \ \ \ \ \rightarrow\ b=1+c+d $ (14)
Third condition:
At the peak of the curve. The value $ \varepsilon_{cnorm}=1 $, $ f_{cnorm}=1 $, the curve slope is equal to zero, so:
$ \varepsilon_{cnorm}=1 $, $ {(f}_{cnorm})\prime=0 $ $ \rightarrow d=1 $ (15)
Substituting the value into equation (14). Equation 16 has been obtained:
b=c+2 (16)
Among the available conditions, the value of two constants a=0 and d=1 has been found, and the remaining constants b and c have equation /16/. Thus, the formula model is as below in Equation 17:
$ f_{cnorm}=\frac{b(\varepsilon_{cnorm})}{1+(b-2)(\varepsilon_{cnorm})+{(\varepsilon_{cnorm})}^2} $ (17)
To find the value of the constant in the previous formula, the analytical process by substituting the values of the coordinates $ x=\varepsilon_{cnorm}\ \ \ $, $ \ y=f_{cnorm} $, from the experimental curve and putting them in the previous Equation 17 has been used. Then obtaining the values of the constant b.
There are many solutions equal to the number of experimental values throughout the substitution of the coordinate values chosen from the ascending part of the curve. There was no noticeable convergence with the selected coordinates from the descending part. So, it is appropriate to distinguish between the values of the constant b for each part of the curve.
Accordingly, this process was applied to all experimental axial compression, in which different percentages of plasticizers were used (2%,2.5%) for different cement quantities (450,500,550 kg/m3).
The values of constant b can be obtained using the Curve Expert1.4 curve processing program as well. Throughout inserting the previous Equation 17. into the program and then the experimental values in two phases for the ascending and descending parts of the curve.
Table 4. below shows the values of the equation constant b according to the cement quantities and plasticizer percentage in the parts of the ascending and descending curve. Throughout substituting the experimental values and using the Curve Expert 1.4 program. In addition to the value of b in general for all cement grades and the plasticizer percentage using the Curve Expert 1.4.
Table 4. Shows the values of the equation constant b
 Therefore, the proposed general mathematical formula could be expressed with the values of constant b in the ascending and descending parts of the curve.
Results and Discussion
The Proposed General Mathematical Formulas for the Stress-Strain Curve of SCC:
The final mathematical formula using the overall values for the b constant could be expressed for the two parts of the stress-strain curve. Figure 9. As the Equation 18 and Equation 19 below:
Ascending part of the curve:
$ f_{cnorm}=\frac{2.14\varepsilon_{cnorm}}{1+0.14\varepsilon_{cnorm}+{\varepsilon_{cnorm}}^2} $
$ \frac{f_c}{{f\prime}_c}=\frac{2.14(\frac{\varepsilon_c}{\varepsilon_{co}})}{1+0.14(\frac{\varepsilon_c}{\varepsilon_{co}})+{(\frac{\varepsilon_c}{\varepsilon_{co}})}^2} $ (18)
Descending part of the curve:
$ f_{cnorm}=\frac{0.57\varepsilon_{cnorm}}{1-1.43\varepsilon_{cnorm}+{\varepsilon_{cnorm}}^2} $
$ \frac{f_c}{{f\prime}_c}=\frac{0.57(\frac{\varepsilon_c}{\varepsilon_{co}})}{1-1.43(\frac{\varepsilon_c}{\varepsilon_{co}})+{(\frac{\varepsilon_c}{\varepsilon_{co}})}^2} $ (19)
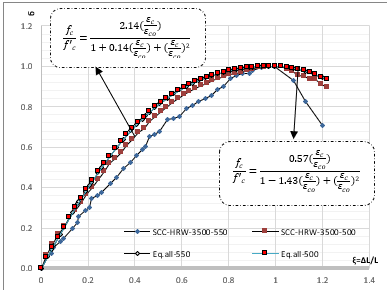 Fig. 9. Stress-Strain Curves for SCC and Proposed Eq. at all Cement Grade
The behavior using the derived equation is very close to the laboratory samples. It also improves the stress values and the fluidity in the strain values.In comparing the experimental results of the (σ,ε) with the previous curves, the results for the two ascending and descending parts were different. As close as possible to the POPOVICS curve in the ascending part and the EURO-CEB in the descending one through comparing the proposed formula that describes the behavior of SCC as mentioned in formula .17. with that of POPOVICS, which takes the form 20. below:
$ \frac{f_c}{{f\prime}_c}=\left[\frac{n\frac{\varepsilon_c}{\varepsilon_{co}}}{\left(n-1\right)+{(\frac{\varepsilon_c}{\varepsilon_{co}})}^n}\right] $ (20)
$ \frac{f_c}{{f\prime}_c}=\left[\frac{n\frac{\varepsilon_c}{\varepsilon_{co}}}{\left(n-1\right)+{(\frac{\varepsilon_c}{\varepsilon_{co}})}^n}\right] $ (20)
Through the observation of the two formulas, there is an incomplete similarity in general. However. this similarity can be complete when the value of the constants as below:
n=b=2
The proposed and POPOVICS formulas take the following form 21:
$ \frac{f_c}{{f\prime}_c}=\frac{2\frac{\varepsilon_c}{\varepsilon_{co}}}{1+{(\frac{\varepsilon_c}{\varepsilon_{co}})}^2} $ (21)
It can also verify the conformity of the behaviour proposed in Eq.21 with the actual samples graphically. Below are the stress-strain curves of the proposed formula and the experimental sample. Figure .10:
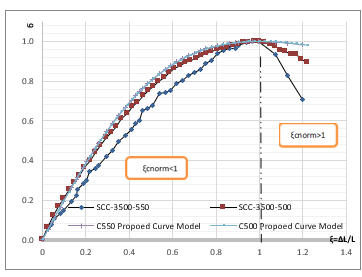
Fig. 10. Stress-Strain Curves for The SCC Proposed Mathematical Formula
It has been found that the mathematical equation 21 in which the POPOVICS formula and the proposed formula are similar, gives graphic curves describing the behavior of local SCC with a convergence of up to 90%.
CONCLUSION
This paper aimed to understand the mechanical behavior of SCC samples. Through laboratory verification and mathematical analysis. The key findings of this study are presented below:
The possibility to produce an acceptable Self-Compacting Concrete SCC from Syrian raw materials.
Outputting a mathematical model that enables us to directly calculate the behavior of all types of SCC samples, and to represent it graphically.
The proposed mathematical model describes the behavior of concrete up to 90% approximate, whatever the quantity of cement.